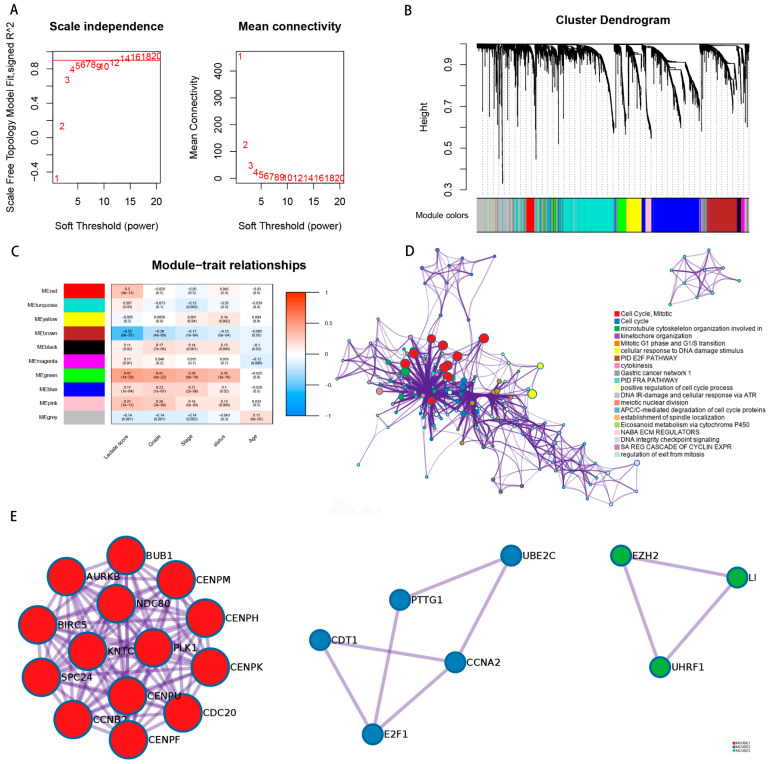
Figure 7.
Gene weight co-expression network analysis and gene function enrichment analysis. (A) Soft power estimation in ccRCC for WGCNA. (B) Gene dendrogram with different colors showing the modules identified by WGCNA. (C) The relationship between gene modules and clinical characteristic. (D) Potentially enriched pathways of the co-expressed genes in green module. (E) The protein–protein interaction network of the top three signaling pathways.

