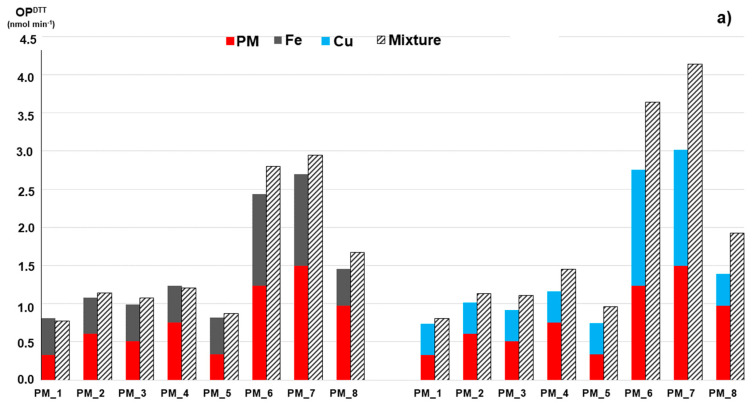
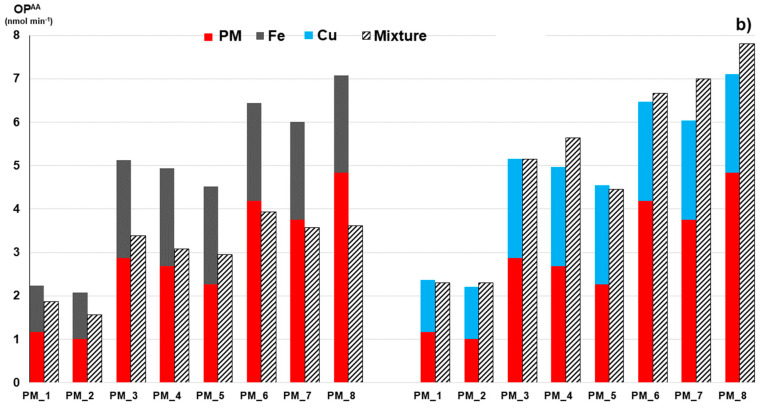
Figure 2.
DTT consumption OPDTT (a) and AA consumption OPAA (b) activities of the real-world PM2.5 samples. The bottom red bars indicate OP of each individual PM extract, the top bars are OP of the standard solutions of Fe and Cu added to the extract (grey: Fe, light blue: Cu), while the staked bars show OP experimentally measured on their combinations. OP is expressed as nmol min−1. The concentrations of the added Fe and Cu solutions are reported in Table 4.


