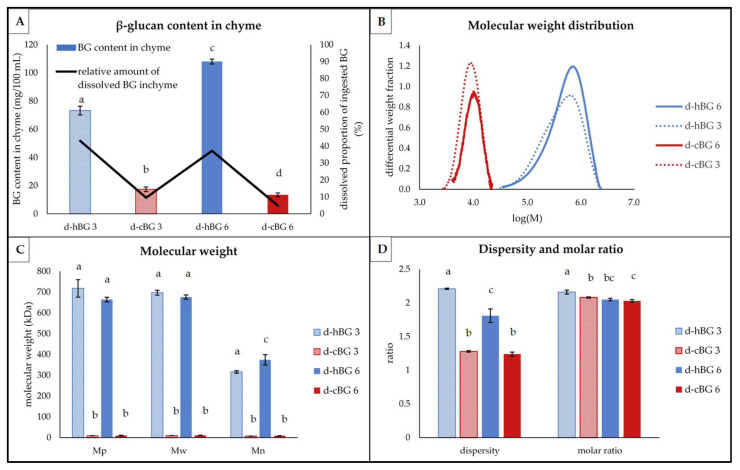
Figure 5.
Structural characteristics of β-glucan (BG) present in digested breads breads fortified with 3% of high molar mass BG or control BG (d-hBG 3 or d-cBG 3) and 6% of high molar mass BG or control BG (d-hBG 6 or d-cBG 6) presented as: (A) BG content (bars) and proportion ingested BG, which got dissolved in the chyme; (B) molar mass distribution shown as differential weight fraction plotted against the logarithmic molar mass (M); (C) peak- (Mp), weight average- (Mw) and number average (Mn) molar mass; (D) dispersity and molar ratio. All values are shown as mean ± standard deviation (n = 3, p < 0.05). Different lower-case letters indicate a significant difference between the breads for each characteristic.

