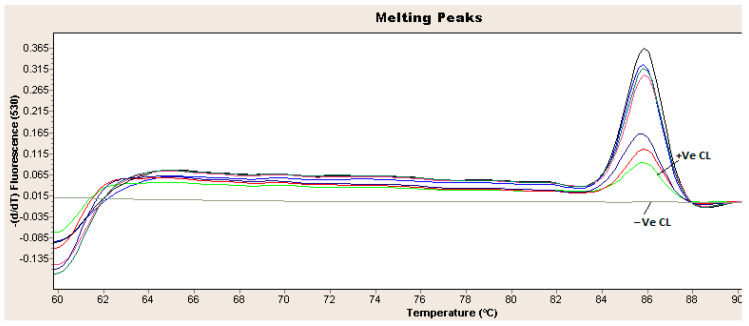
Figure 5.
Real-time PCR amplification curves. Melting curve of the amplified FAdV-4 hexon gene from infected chickens tested tissue specimens (heart, spleen, kidney or liver). The arrows indicate positive control (+Ve CL) and negative control (−Ve CL). The qPCR was performed with LightCycler® 2.0 Instrument.

