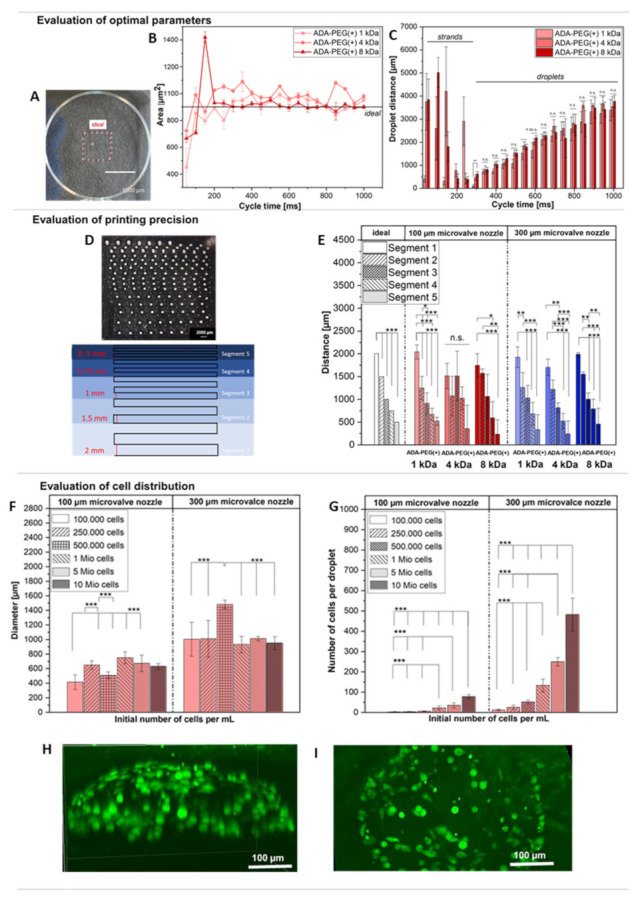
Figure 6.

(A) Image of printed ADA-PEG(+) 1 kDa droplets using a square rectangle template with dimensions of 10 × 10 mm on PS with an added red square representing borders of the simulated ideal area. Scaffolds were printed using a 300 µm microvalve nozzle (n = 6); (B) influence of cycle time on the printing precision of a printed square shaped scaffold using ADA-PEG(+) 1, 4 and 8 kDa inks determined by the overlapping of the stimulated area with the printed one. Scaffolds were printed using a 300 µm microvalve nozzle (n = 6); (C) influence of the cycle time on droplet distances using ADA-PEG(+) 1, 4 and 8 kDa inks printed on PS. Scaffolds were printed using a 300 µm microvalve nozzle (n = 6); (D) illustration of the resolution tree for the filament fusion test showing segments 1–5 (bottom) and a light microscopy image of the printed version using ADA-PEG(+) 1 kDa on PS (up); (E) diagram showing the distances between the segments 1–5 of the printed resolution tree for filament fusion tests of ADA-PEG(+) 1 kD, 4 kDa and 8 kDa on PS. Scaffolds were printed using 100 and 300 µm microvalve nozzles (n = 2); (F) determined diameters of printed ADA-PEG(+) 1 kDa droplets containing NIH/3T3 cells (100,000–10 Mio·mL−1) using 100 µm and 300 µm microvalve nozzles (n = 20); (G) determined cell concentrations per printed ADA-PEG(+) 1 kDa droplet containing NIH/3T3 cells (100,000–10 Mio·mL−1) using 100 µm and 300 µm microvalve nozzles (n = 20); (H) confocal image of Calcein-stained NIH/3T3 cells (1 Mio·mL−1) in printed ADA-PEG(+) 1 kDa droplets on HPL: view z-direction and (I) view from top. ns * p < 0.05, ** p < 0.01, *** p < 0.001.
