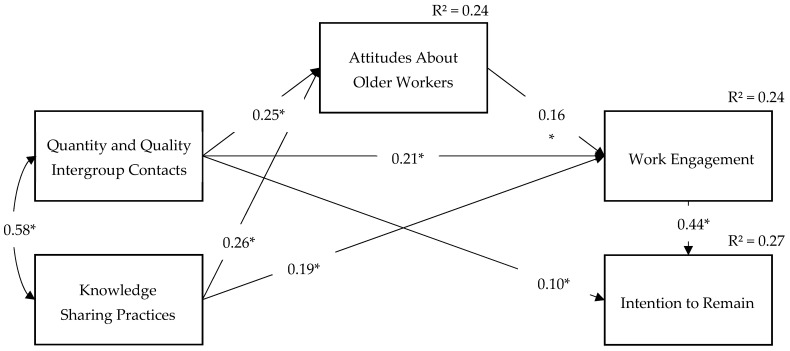
Figure 2.
Final path diagram and hypotheses testing. Control variables are omitted in the figure. Model fit. χ² (3) = 5.09, p = 0.17 (CMIN/DF = 1.70; TLI = 0.98; CFI = 0.99; RMSEA = 0.03). Notes. RMSEA = root mean square error of approximation; CFI = comparative fit index; TLI = Tucker–Lewis Index. In this model, age acts as a control variable on Attitudes About Older Workers and Intentions to Remain. * p < 0.05.

