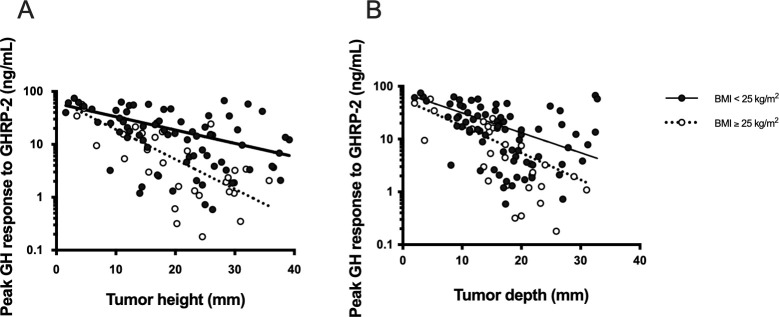
Fig 3. Peak GH response to GHRP-2 and tumor size in overweight and non-overweight patients.
(A, B) Open circles and closed circles represent peak GH response to GHRP-2 in overweight (BMI ≥ 25 kg/m2) and non-overweight patients (BMI < 25 kg/m2), respectively. The dotted and solid lines represent linear regression curves between peak GH response to GHRP-2 and tumor height (A) and tumor depth (B) in overweight (BMI ≥ 25 kg/m2) and non-overweight patients (BMI < 25 kg/m2), respectively. GH, growth hormone; GHRP-2, growth hormone-releasing peptide-2; BMI, body mass index.

