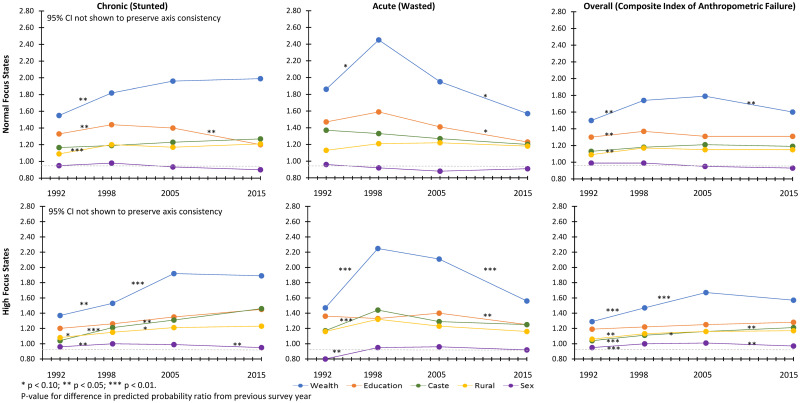
Fig 4. Trends in socioeconomic disparities for child undernutrition among normal focus and high-focus states.
Data from the 1992, 1998, 2005, and 2015 NFHS. CI, confidence interval; NFHS, National Family Health Survey. Predicted probability ratio for wealth (lowest quintile/highest quintile), maternal education (none/secondary or higher), caste (scheduled caste or tribe/general), location of residence (rural/urban), and child sex (female/male) were estimated after mutually adjusting for each other as well as child’s age, birth order, religion, and maternal age. Northeast focus states not shown because prevalence ratio were not estimable due to small sample size.

