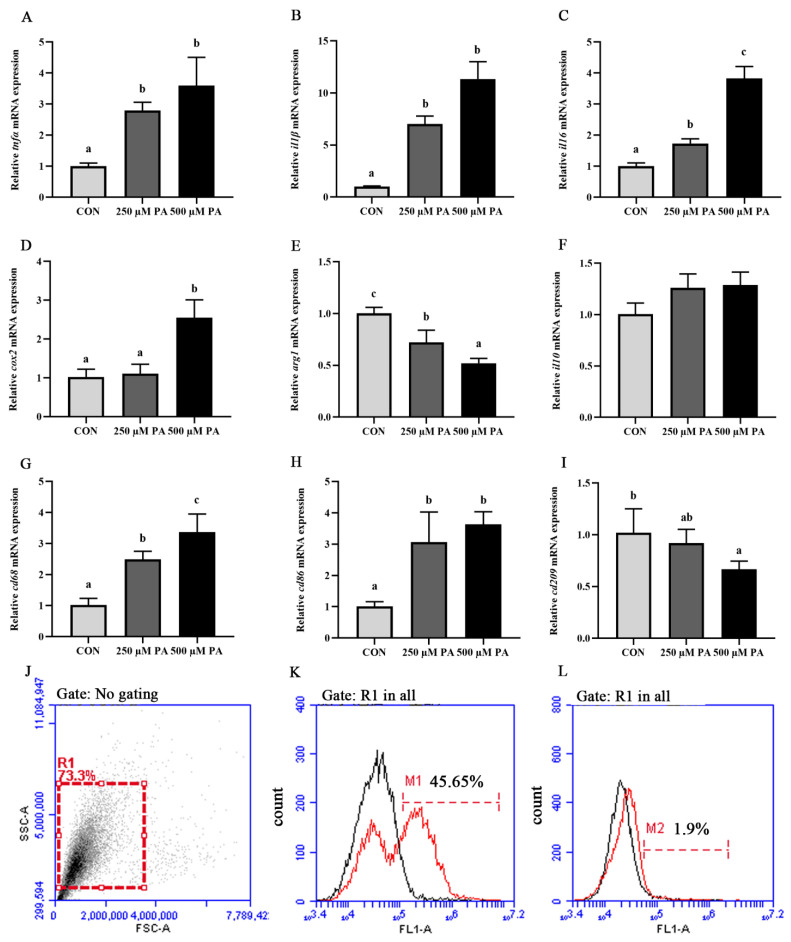
Figure 1.
PA induced inflammatory response in macrophages of large yellow croaker. (A–I) mRNA expression levels of inflammatory genes (tnfα, il1β, il6, cox2, arg1 and il10) and macrophage markers (cd68, cd86 and cd209) after PA treatment (n = 6). (J–L) Fluorescence histograms of CD68+ (K) and CD209+ (L) populations after PA treatment (scale of M1). Represent macrophages gated (R1) on a forward scatter (FSC) versus side scatter (SSC) dot plot. Data are presented as the means ± SEM and are analyzed using one-way ANOVA, followed by Tukey’s test. Bars labeled with the same letters are not significantly different (p > 0.05).

