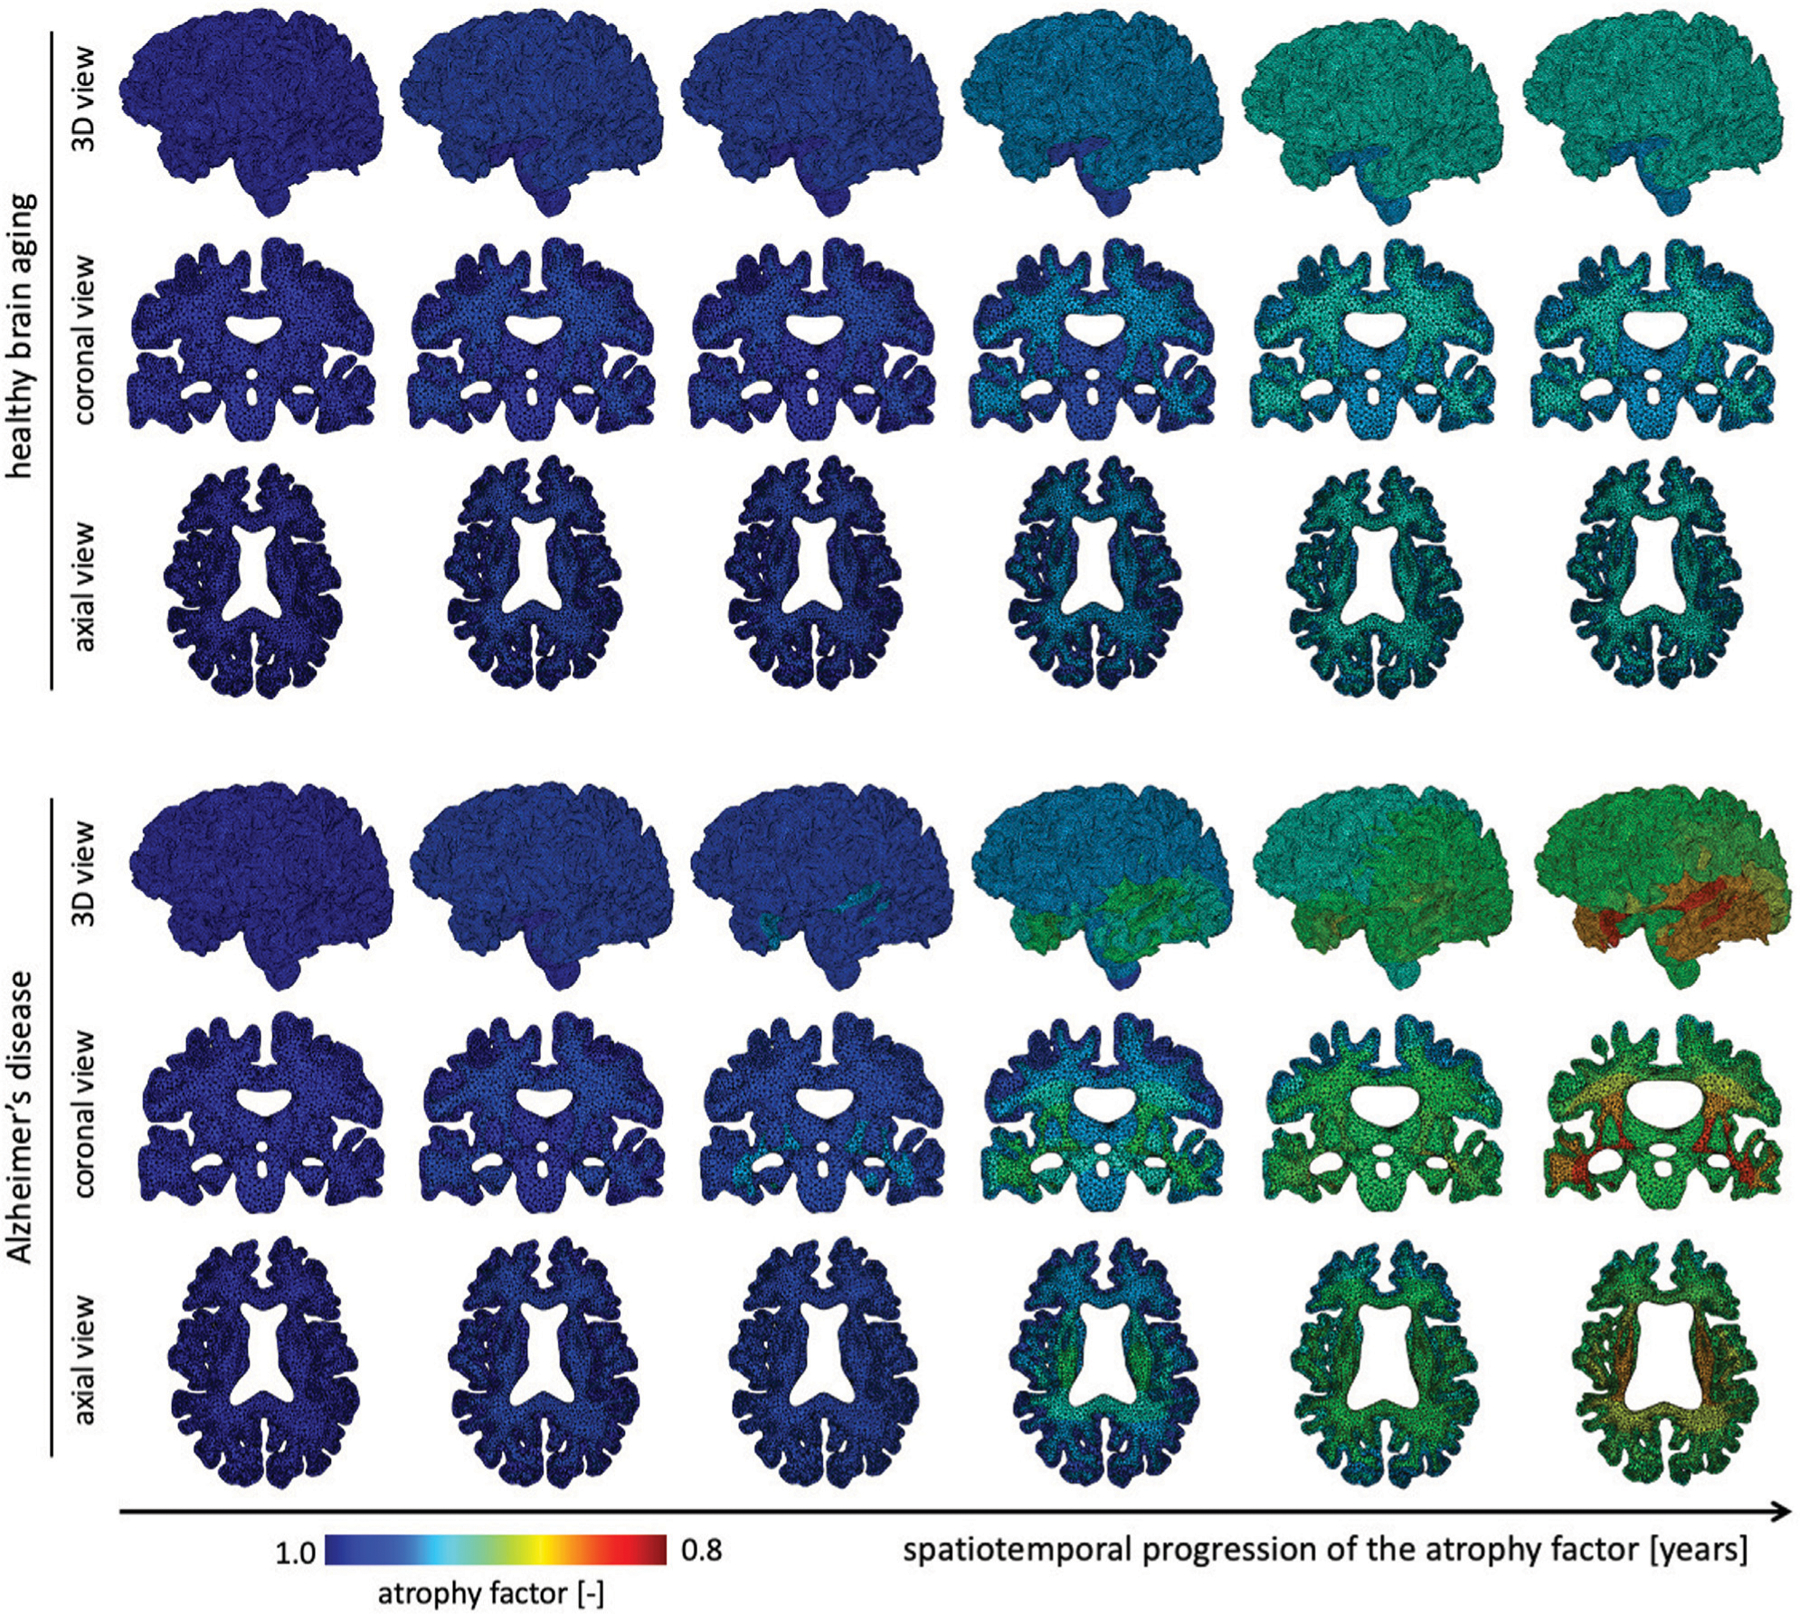
FIGURE 4 |.

We show the spatial distribution of the atrophy factor over our simulation period of 40 years. In our model we differentiate between healthy (top rows) and accelerated, or pathological, aging (bottom rows). We prescribe a constant, albeit different, atrophy rate for gray and white matter tissue in healthy aging. In pathological aging, the atrophy factor in Alzheimer’s disease is coupled to the biomarker concentration and increases the atrophy factor once biomarker concentration exceeds a critical value; therefore, the AD-related atrophy factor follows a similar spatiotemporal progression pattern as the biomarker concentration. Atrophy factor of one corresponds to no volume change and we observe a maximum volume loss of 0.798. Since cross-sectional studies have identified more white matter volume loss in comparison to gray matter, we prescribe a higher atrophy rate which leads to more pronounced WM atrophy, see coronal and axial view.
