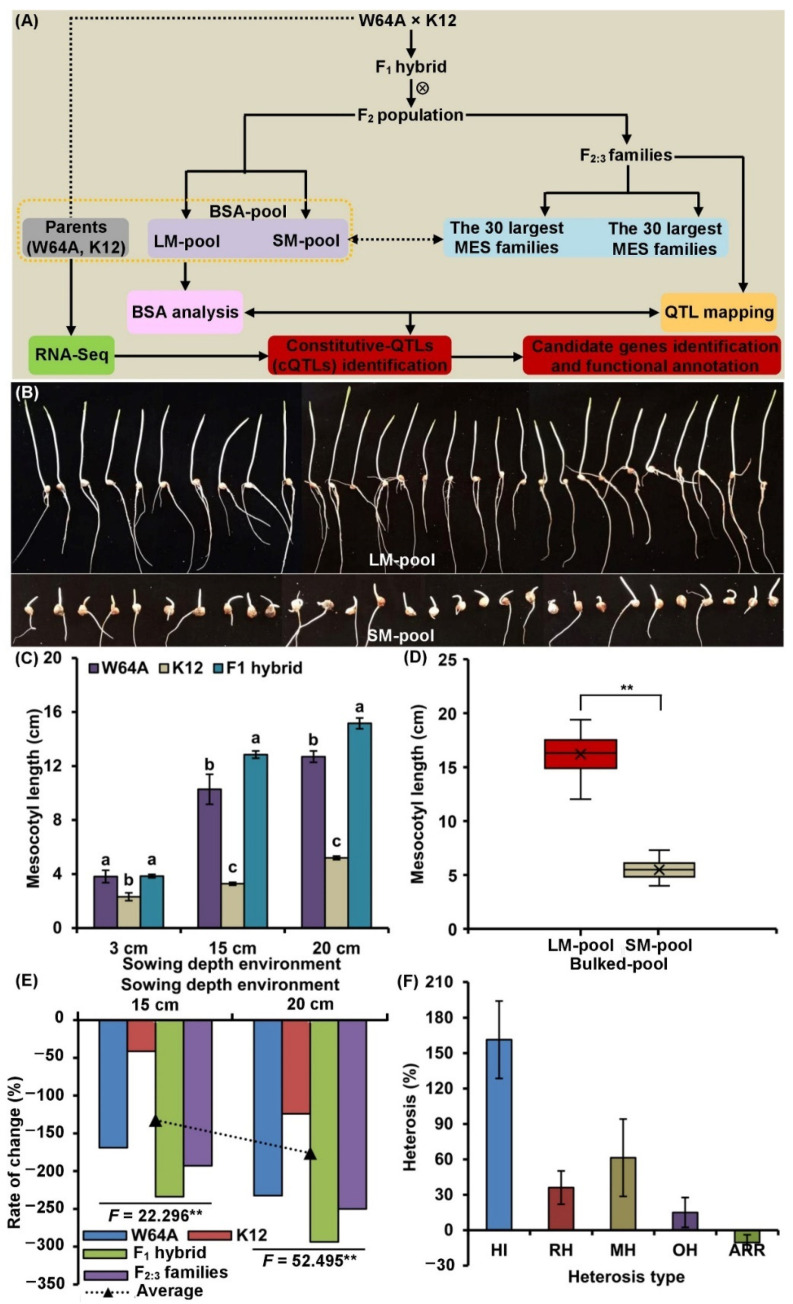
Figure 1.
Performance of mesocotyls at three sowing environments. (A) Schematic diagram of experimental population construction and analysis. (B) Performance of the mesocotyl length (MES) of LM pool (the 30 largest MES-pool) and SM pool (the 30 shortest MES-pool) at a 20 cm sowing environment. (C) MES of the parents (W64A and K12) and their F1 hybrid under 3, 15, and 20 cm sowing environments, respectively; different lowercase letters with different materials in a single environment indicated a significant difference with p < 0.05 (ANOVA). (D) Boxplot of MES showing the difference between LM pool and SM pool used for a BSA under 20 cm sowing environment; asterisks indicated significant differences (** p < 0.01; ANOVA). (E) Compared to 3 cm sowing conditions, the rate of change (RC) of MES in two parents, F1 hybrid, and F2:3 population under 15 and 20 cm sowing conditions, respectively; asterisks indicated significant differences (** p < 0.01; ANOVA). (F) Heterosis analysis (HI: F1 heterosis index, RH: relative heterosis, MH: mid-parent heterosis, OH: over-parent heterosis, ARR: F2:3 advantage reduction rate) of MES.

