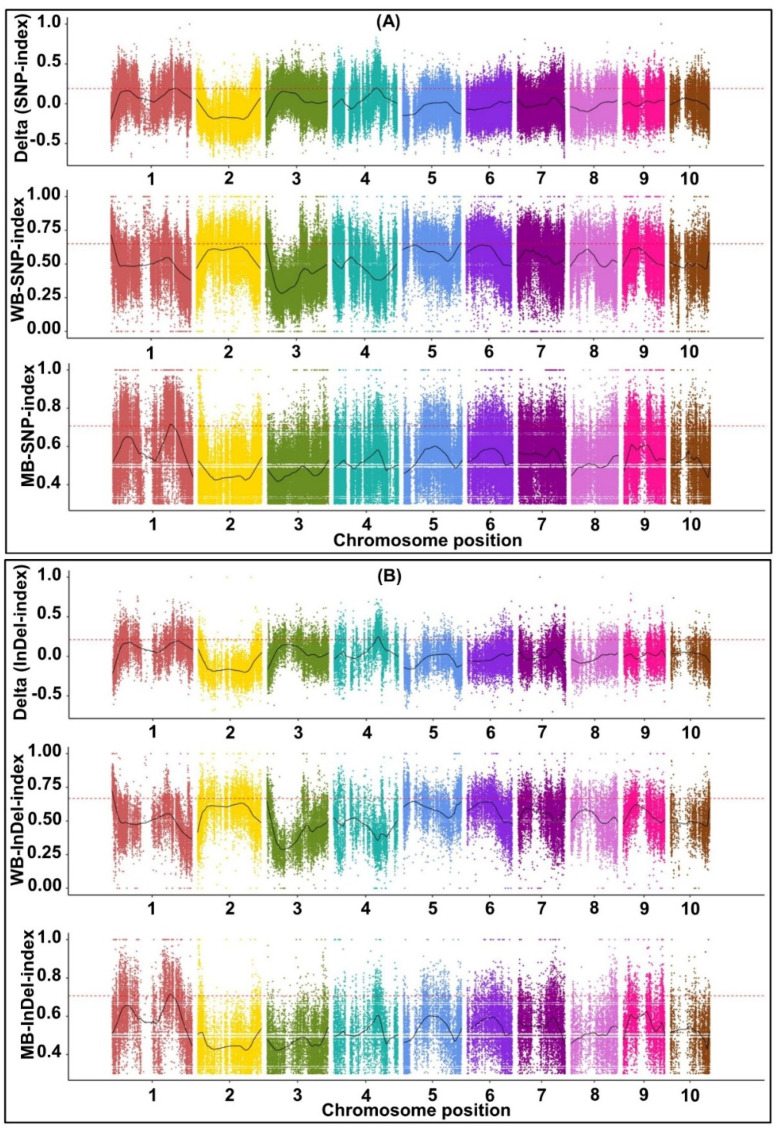
Figure 4.
Distribution of SNP index (A) and InDel index (B) correlation value on chromosomes by BSA analysis of mesocotyl length (MES) under 20 cm sowing environment. The x-axis was the chromosomes, the colored dots represented the calculated SNP-index/InDel-index (or △SNP-index/△InDel-index) value, and the black line was the fitted SNP-index/InDel-index (or △SNP-index/△InDel-index) value. The red line represented the threshold line with a confidence level of 0.99.

