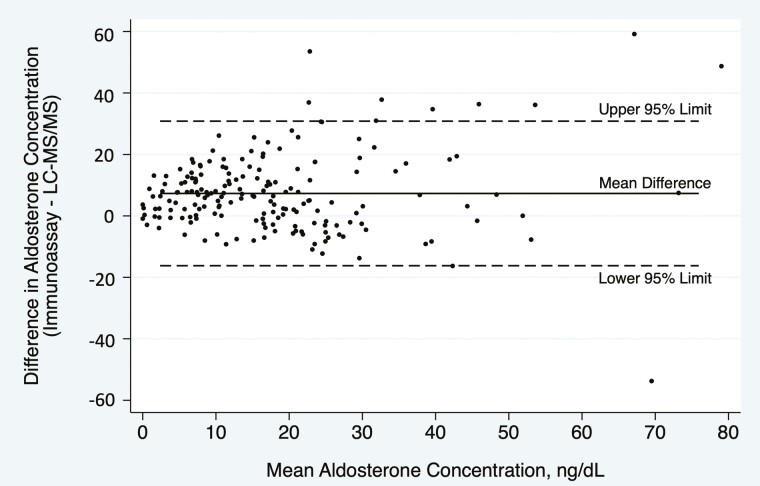
Figure 3.
Bland–Altman plot demonstrating agreement between immunoassay and LC-MS/MS. The 2 assays yielded an average difference in aldosterone concentration of 7.3 ng/dL higher (solid line; SD 12.0 ng/dL) by immunoassay than using LC-MS/MS, with 95% limits of agreement from –16.2 to 30.8 ng/dL (dashed lines), comparing all 188 samples from n = 48 subjects across 4 experimental conditions.

