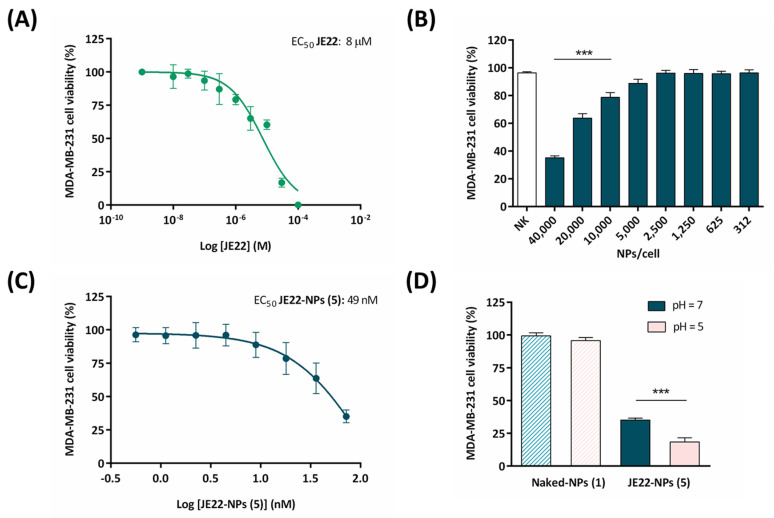
Figure 5.
Evaluation of cell viability of the designed nanodevice (JE22-NP, 5) (A) Dose–response curves for JE22 against MDA-MB-231 cells after 5 days of treatment. Error bars: ±SD from n = 3. (B) Bar graph showing the effect of JE22-NPs (5) on cell viability of MDA-MB-231 cell line. A standard range of added nanoparticles per cell (NPs/cell) to evaluate cell viability was used (from 312 to 40,000). Calculation of the NPs/cell was based on the number of NPs per volume (Figure S7). Naked-NPs (1) (NK) were used as control. Data represent the mean ± SD of three independent experiments; *** p < 0.001 (ANOVA). (C) Dose–response curve (percentage of cell viability versus concentration) of MDA-MB-231 cells after treatment with JE22-NPs (5), represented in molarity (nM). EC50 value was obtained by the logarithm versus normalized response: variable slope using the GraphPad software. (D) Therapeutic effect representation by bar graph of JE22-NPs (5) at pH = 7.4 versus cell viability at pH = 5. Cell viability was tested after 5 days. Naked-NPs (1) were used as control. The experiments were carried out in triplicate, and the results are expressed with the values of the mean ± SD; *** p < 0.001 (ANOVA).

