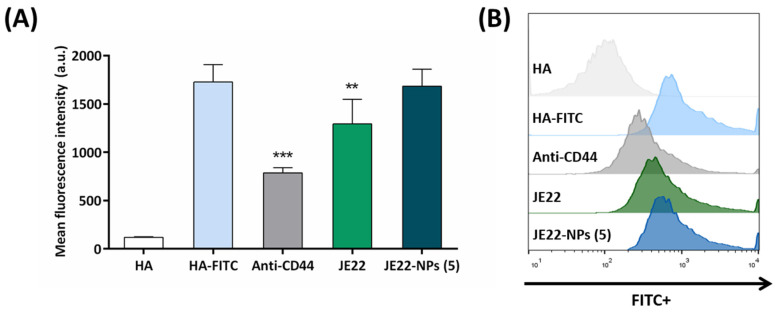
Figure 7.
Inhibition of the HA–CD44 interaction by flow cytometry. (A) Mean fluorescence of MDA-MB-231 cells analyzed by flow cytometry after treatment for 30 min at 4 °C with JE22-NPs (5), JE22, and anti-CD44 followed by incubation with HA-FITC for 15 min at 4 °C. Cells treated with unlabeled HA and HA-FITC were used as the negative and positive control, respectively. Error bars: ±SD from n = 3; p < 0.01, **; p < 0.001, *** (ANOVA). (B) Flow cytometry overlay histograms of HA-FITC competitive assay binding to MDA-MB-231 cells.

