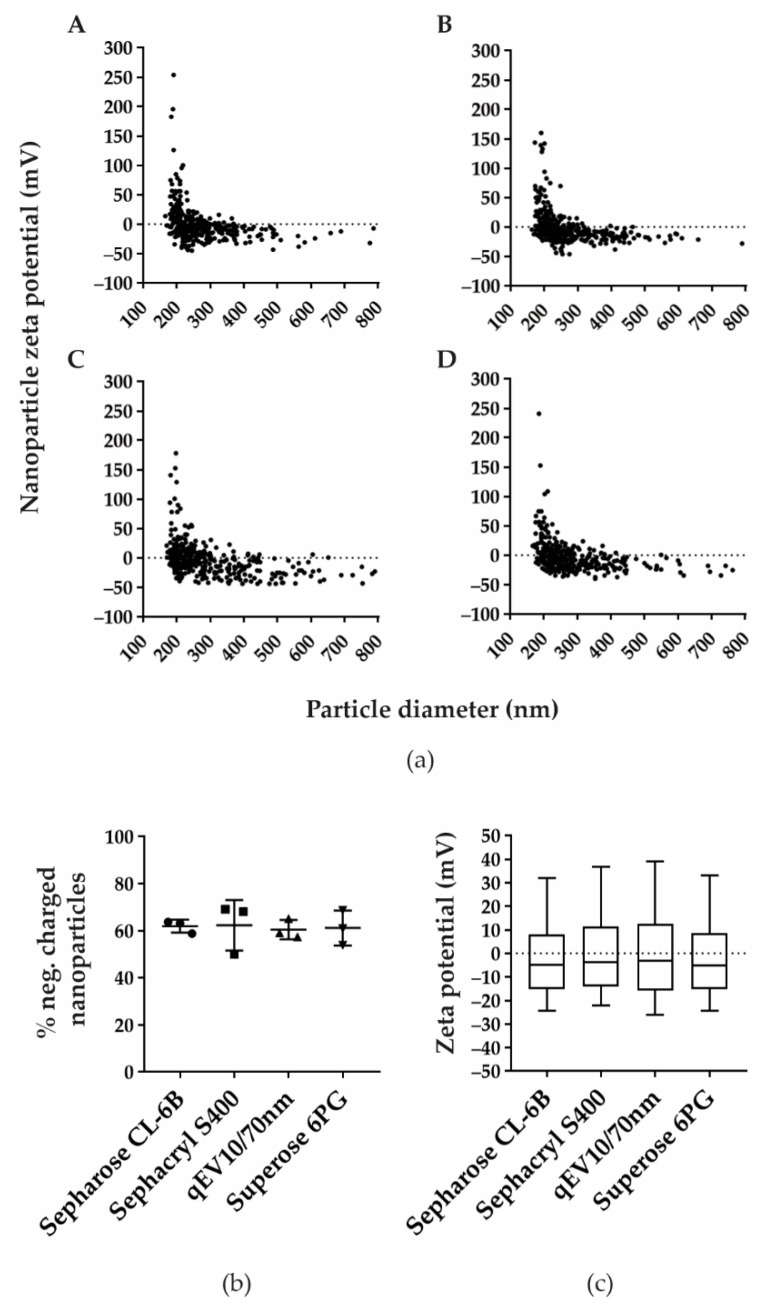
Figure 3.
Zeta potential and percentage of negatively charged isolated nanoparticles are comparable in all four SEC methods. (a) Zeta potential was measured in TRPS positive fractions after separation by Sepharose CL-6B (A), Sephacryl S-400 (B), qEV10/70 nm (C), and Superose 6PG (D). Shown are representative distributions of nanoparticle zeta potential measured in millivolts (mV) and nanoparticle diameter measured in nanometres (nm). (b) Percentage of negatively charged nanoparticles are shown as mean values with their standard deviation from three experiments for each SEC method. (c) Measured zeta potentials are presented as median values and interquartile ranges (boxes) coupled with 10–90 percentile ranges (whiskers).

