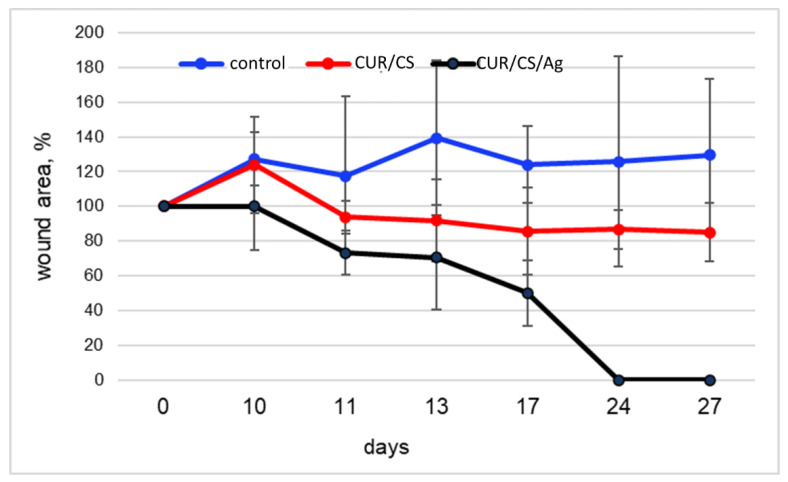
Figure 10.
The influence of membranes (red—CUR/CS; black—CUR/CS/Ag; blue—untreated control) on the dynamics of the wound defect closure. The graph shows the dynamics of the closure of a full-thickness skin defect in mice with genetically determined type 2 diabetes mellitus. Each animal (n = 3 in each group in total) received a control wound (without therapy) and an experimental wound (treatment with test materials). The percentage of closure was calculated based on the initial size of the wounds in order to assess the actual dynamics of healing. The graph shows the increase in the sparing of the control wounds for all observation times, as well as wounds with CUR/CS therapy on day 10 (removal of the dressing).

