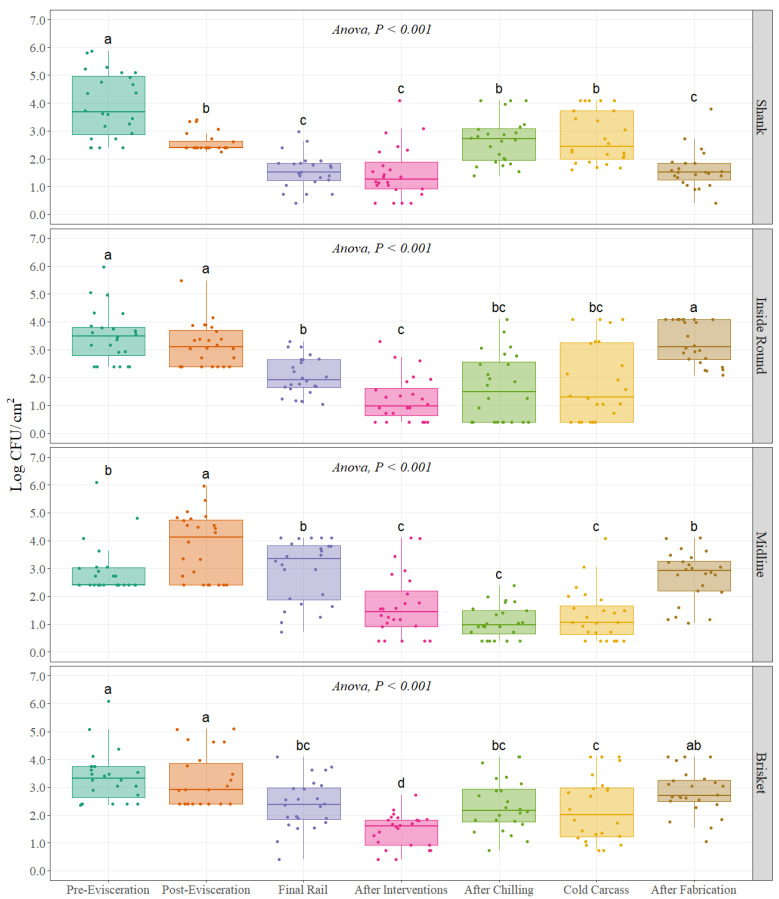
Figure 1.
Mesophilic aerobic plate counts (Log CFU/cm2) at different carcass regions throughout different sampling locations of the beef processing line (n = 24 swabs per carcass region/sampling location). In each boxplot, the horizontal line crossing the box represents the median, the bottom and top of the box are the lower and upper quartiles, the vertical top line represents 1.5 times the interquartile range, and the vertical bottom line represents 1.5 times the lower interquartile range. (a–d) For each individual carcass region, boxes with different letters are significantly different according to ANOVA analysis followed by a pairwise comparison t-test at p < 0.05. The points represent the actual data points.

