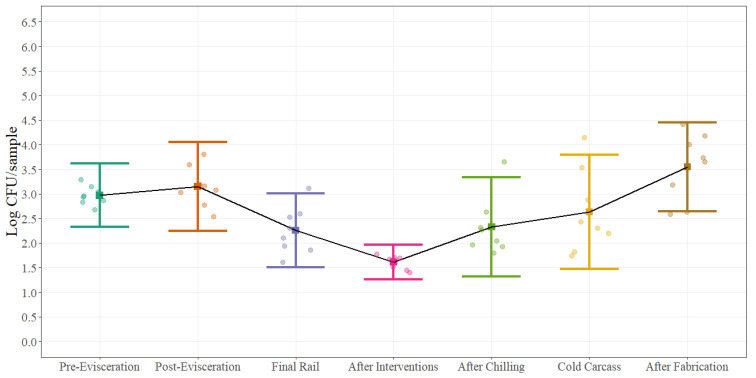
Figure 5.
Statistical microbial process control for Enterobacteriaceae (EB) (Log CFU/sample; equivalent to Log CFU/100 cm2) at different sampling locations on the beef processing line. Solid squares represent the mean of each sampling point for all carcass regions and error bars represent ±3 standard deviations around the mean using a sample size of 12 swabs for each microorganism. The black solid line represents the change on the average of each sampling point throughout the beef processing line for each microorganism. The points represent the actual data points.

