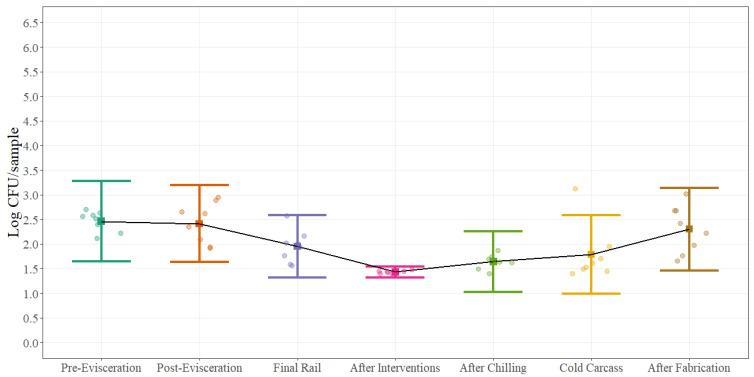
Figure 6.
Statistical microbial process control for Escherichia coli (EC) (Log CFU/sample; equivalent to Log CFU/100 cm2) at different sampling locations on the beef processing line. Solid squares represent the mean of each sampling point for all carcass regions and error bars represent ±3 standard deviations around the mean using a sample size of 12 swabs for each microorganism. The black solid line represents the change on the average of each sampling point throughout the beef processing line for each microorganism.

