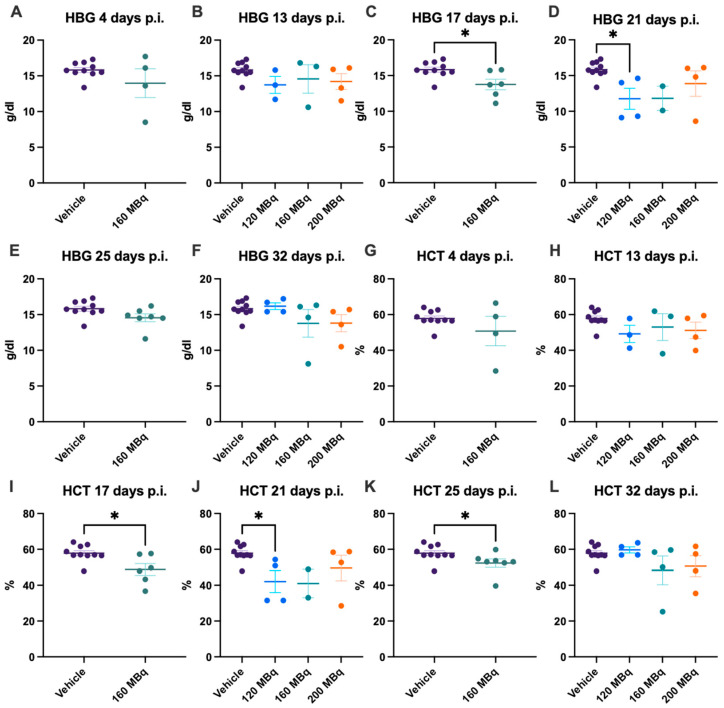
Figure 4.
HBG after 4 (A), 13 (B), 17 (C), 21 (D), 25 (E), and 32 days (F) post injection of 120 MBq (B,D,F), 160 MBq (A–F), or 200 MBq (B,D,F). HCT after 4 (G), 13 (H), 17 (I), 21 (J), 25 (K), and 32 days (L) post injection of 120 MBq (H,J,L), 160 MBq (G–L), or 200 MBq (H,J,L). Values are presented as individual plots with group mean ± SEM. Differences between groups were analyzed using an unpaired t-test (A,C,E,G,I,K) or one-way ANOVA with post-hoc Tukey (B,D,F,H,J,L). * p < 0.05.

