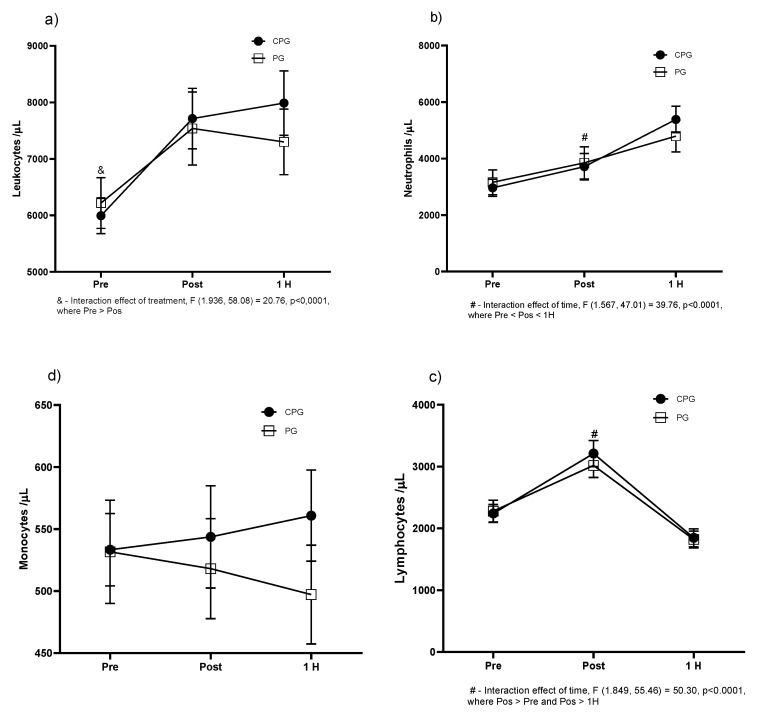
Figure 3.
Graphs representing the leukocyte count across time: pre, post, and 1 h after performing the experimental running protocol. (a) Total leukocytes; (b) neutrophils; (c) monocytes; (d) lymphocytes. Values represented by the mean ± SD, (#) interaction (effect time), (&) interaction (time × treatment).

