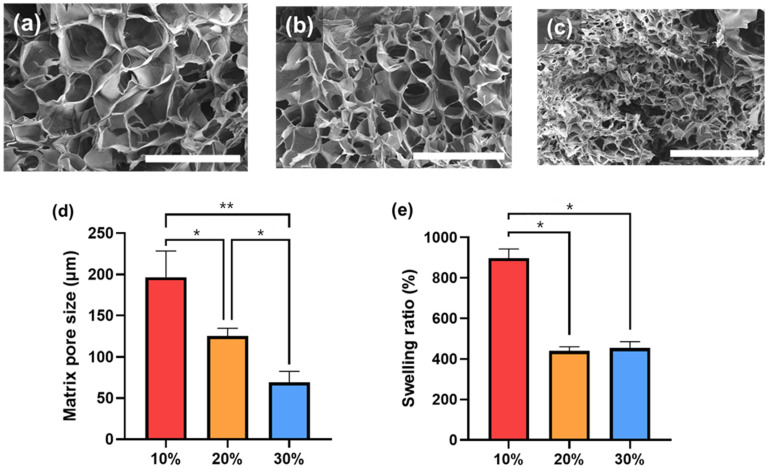
Figure 3.
Scanning electron microscopy (SEM) images of (a) 10%, (b) 20%, and (c) 30% furfuryl-gelatin hydrogels. Scale bars are 500 μm. (d) Matrix pore sizes of furfuryl-gelatin hydrogel matrices (n = 10). (e) Equilibrium swelling ratio of furfuryl-gelatin hydrogels. The significant differences are represented by 0.01 < p < 0.05 (*) and p < 0.01 (**).

