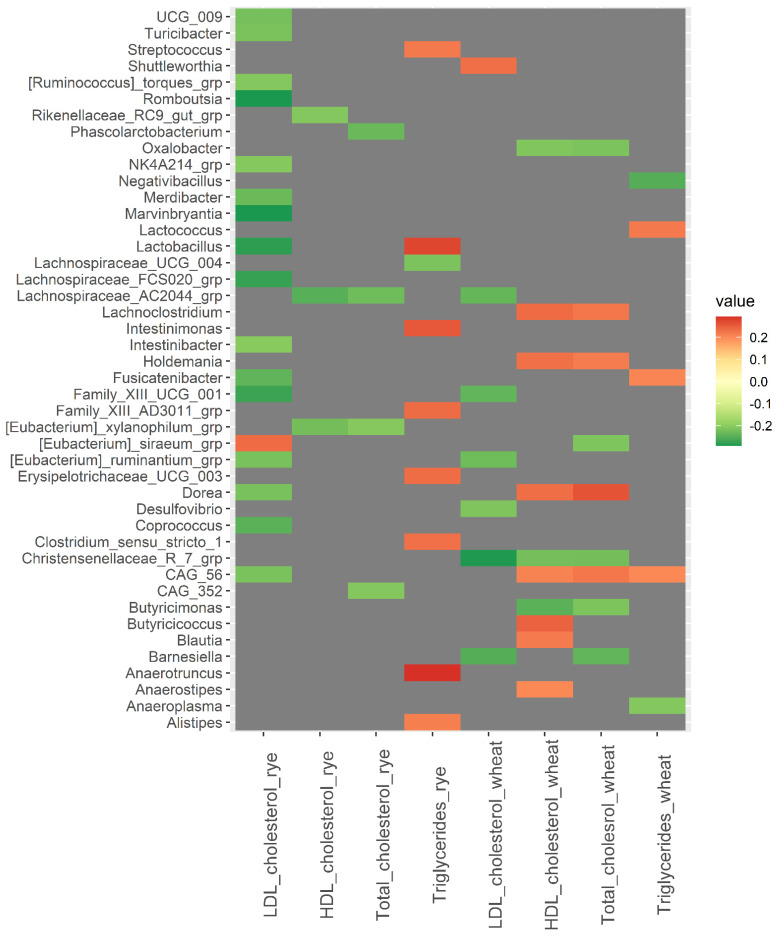
Figure 4.
Heatmaps of correlations (Spearman’s rho) between bacterial abundance at baseline and changes in blood lipids over 12 weeks within the wheat group and the rye group. Only significant correlations with Spearman’s rho ≥ |0.200| are included in the heatmap, while correlations for all 110 bacteria are shown in Supplementary File S2. Abbreviations: LDL, low-density lipoprotein; HDL, high density lipoprotein.

