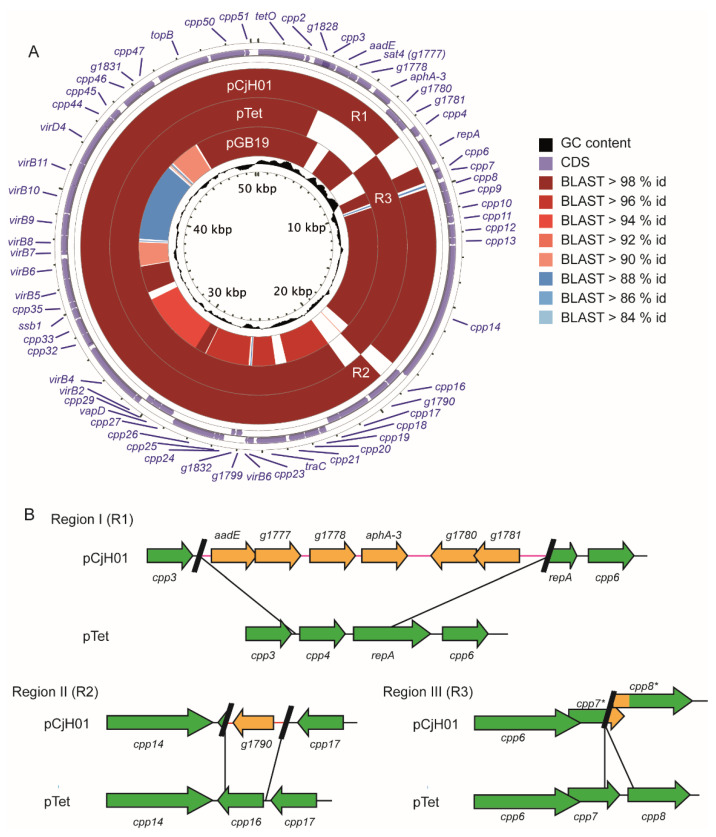
Figure 3.
The pCjH01 plasmid has high similarity with the pTet plasmid. (A) Comparison between the pCjH01, pTet, and pGB19 plasmids. The regions I (RI), II (RII), and III (RIII) are indicated. The three plasmids were aligned by blastn to an inclusive artificial “pangenome” sequence constructed from both pCjH01 and pTet to show regions that are present or absent from each plasmid with respect to the others. The level of BLAST percent identity is indicated by color according to the legend. The annotated ORFs correspond to the combined annotation of all three plasmids. (B) Representation of regions I, II, and III in both pCjH01 and pTet. Green arrows and black lines indicate the sequences present in both plasmids, whereas orange arrows and red lines indicate the sequences only present in pCjH01.

