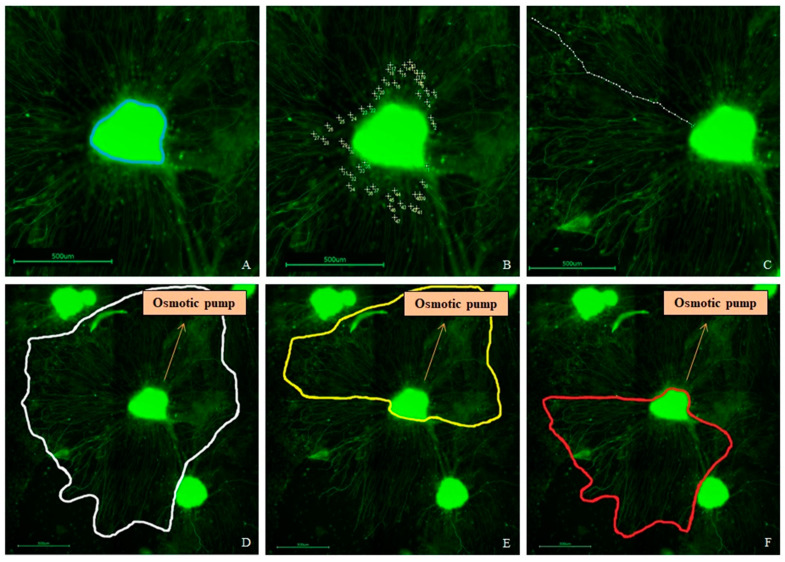
Figure 5.
Examples of an analysis of the Spiral Ganglion Explant (SGE) parameters after neurofilament labeling (green). (A) Measured SGE area (blue line). (B) Counted number of outgrown neurites. (C) Measured length of one of the analyzed 40 longest outgrown neurites. (D) Neurite outgrowth area determined by connecting the ends of all neurites (white line). (E) Area of neurites grown towards the osmotic pump (yellow line). (F) Area of neurites grown opposed to the pump (red line). Included arrows indicate the direction towards the osmotic pump. Scale bars: 500 µm.

