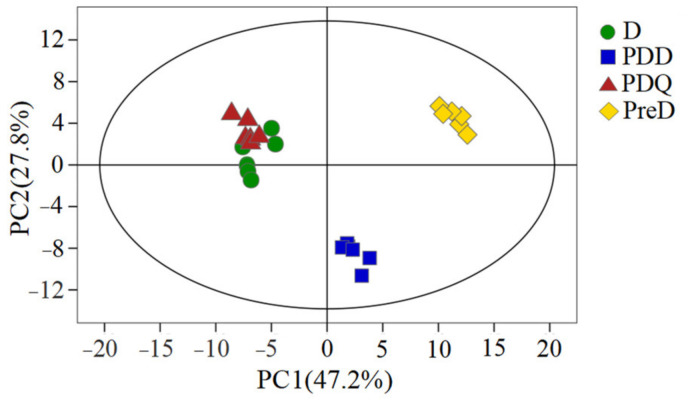
Figure 1.
Principal component analysis (PCA) score plot of the metabolite profiles of S. mosellana larvae at pre-diapause (PreD), diapause (D), post-diapause quiescence (PDQ) and post-diapause development (PDD). Data points are displayed as sample projections onto the two primary axes. Oval represents the 95% confidence interval of the model using Hotelling T2 statistics. Variances explained by the first two components (PC1 and PC2) are shown in parentheses.

