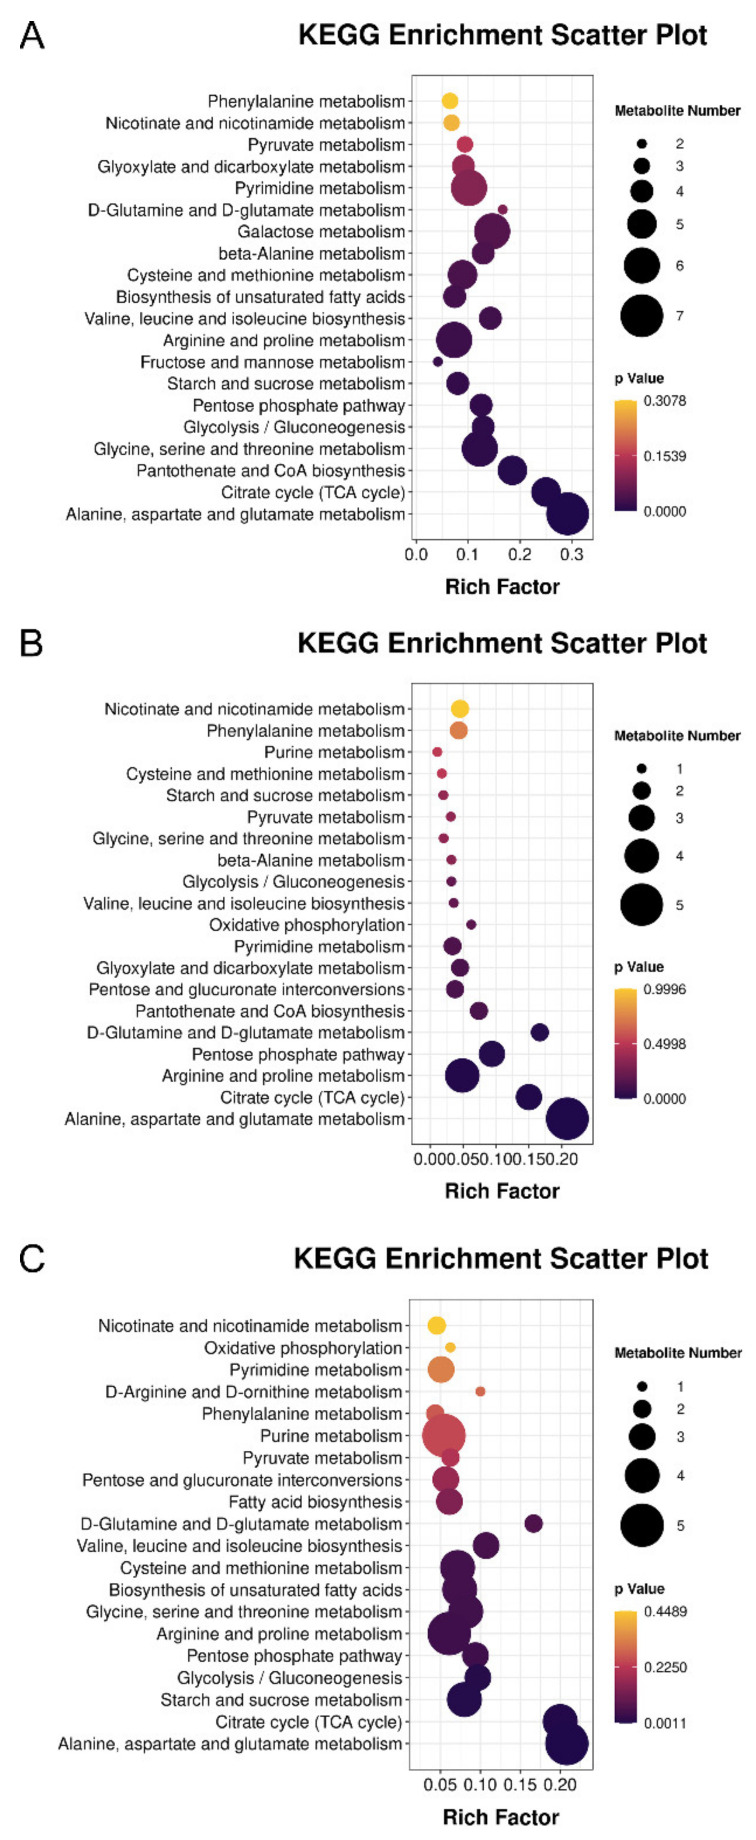
Figure 5.
Pathway analysis of differential metabolites for three pairwise comparisons including “diapause versus pre-diapause” (A), “post-diapause quiescence versus diapause” (B) and “post-diapause development versus post-diapause quiescence” (C). The color and size of the shapes represent the effect of the diapause on the metabolism pathways. Large, dark shapes indicate a greater effect on the pathway.

