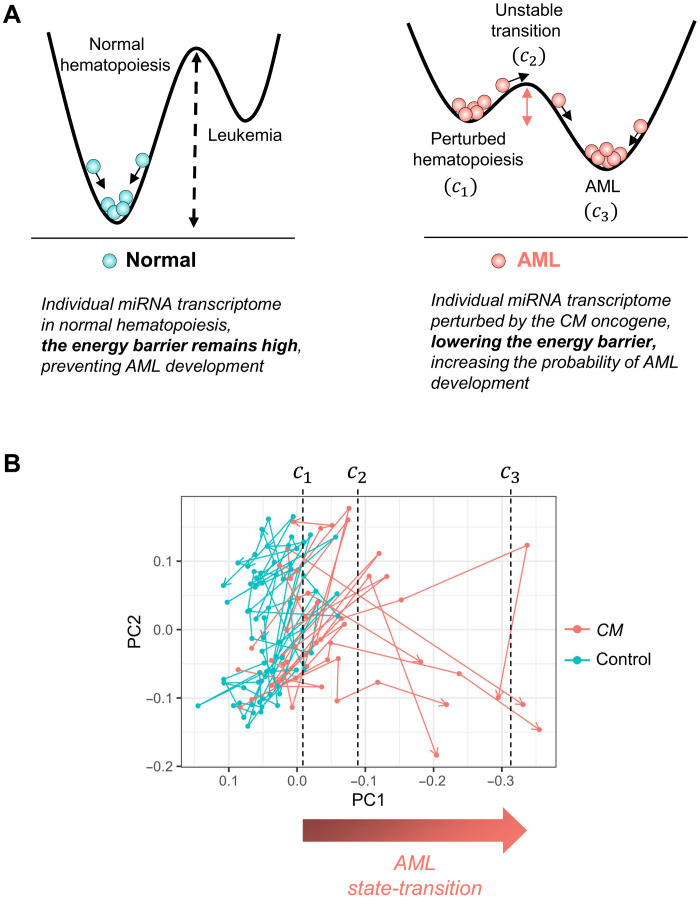
Fig. 1. AML state-transition model and state-space.
(A) Our state-transition model represents the miRNA transcriptome as a particle undergoing Brownian motion in a double-well quasi-potential. The time evolution of the miRNA transcriptome is represented as movement in the potential. In normal control mice in the absence of an oncogenic event, there exists a large energy barrier between a state of normal hematopoiesis and AML, corresponding to a low probability of state-transition (left). An oncogenic event, such as Cbfb-MYH11 (CM) fusion resulting from inv(16), alters the quasi-potential, reducing the energy barrier and increasing the probability of state-transition (right). The states are characterized by local maxima and minima, labeled c1, c2, and c3, corresponding to perturbed hematopoiesis, an unstable transition, and AML states, respectively. (B) The first two PCs (PC1 and PC2) of a time-series study of miRNA expression in a murine model of CM-driven AML reveals state-transition trajectories that are mapped to critical points in the model.

