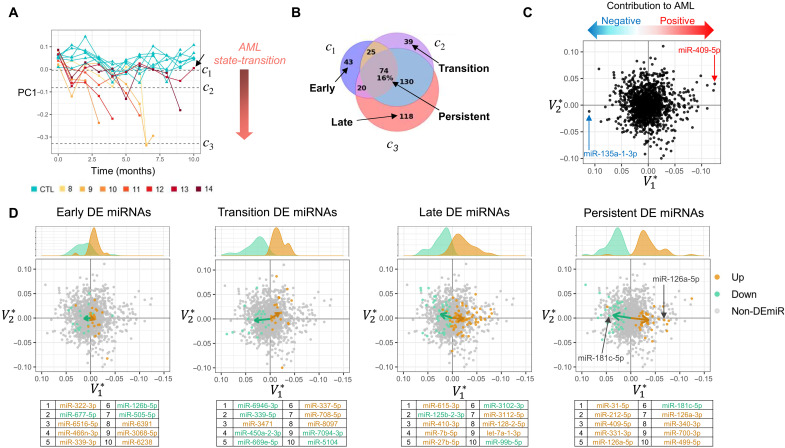
Fig. 2. Critical point–based differential expression analysis.
(A) The miRNA transcriptome state-transition and critical points are visualized by plotting the first PC (PC1) over time. Trajectories of CM and control mice diverge over time as the value of PC1 becomes more negative as CM mice manifest AML and move toward the AML state (c3). CM mouse 13 did not develop AML and did not cross the transition critical point c2 (black arrow). (B) Critical points in the state-transition model are used to guide differential expression analysis and to define early, transition, late, and persistent differential expression events as compared to control samples. Numbers indicate the number of miRNAs differentially expressed. (C) PC loadings (, ) provide a geometric interpretation of miRNA expression so that miRNA may be identified as having a positive or a negative contribution to the construction of the AML state-space. (D) Early, transition, late, and persistent DE miRNAs shown in the state-space and are colored for up- or down-regulation. The sum total contribution of DE miRNA in each event is visualized as a vector calculated by the mean of all DE miRNAs. The magnitude of the component of the vector indicates how strongly the DE miRNA contributes to AML state-transition (i.e., sample movement toward AML in the state-space). Early events have smaller contribution to AML, revealed by small component, followed by increasing contributions to AML in transition events, with larger contributions in late and persistent events. Kernel density plots show the distribution of values for up- and down-regulated DE miRNAs. Tables indicate the 10 most significantly DE miRNA in each comparison.

