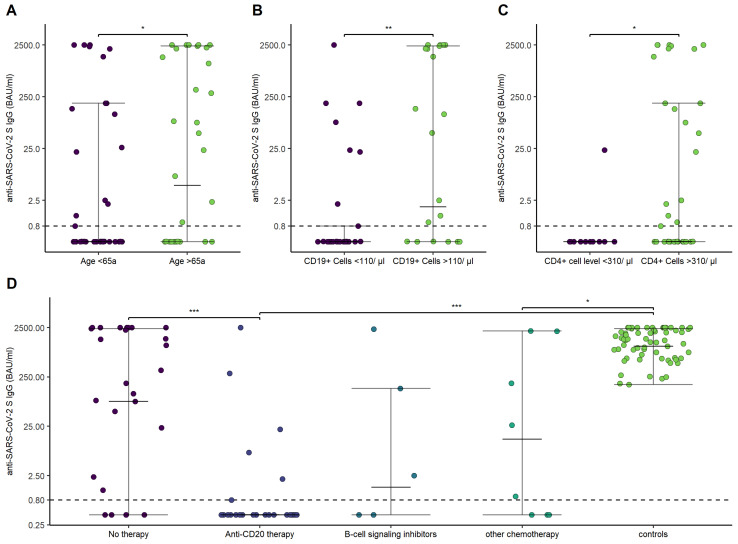
Figure 3.
Anti-SARS-CoV-2 S IgG antibodies in relation to age, CD19+ B-cells and CD4+ T-cells, and different treatments. (A) Anti-SARS-CoV-2 S IgG in dependence of age (<65 versus >65a). (B) Anti-SARS-CoV-2 S IgG in dependence of CD19+ B-cell (<110/µL versus >110/µL). (C) Anti-SARS-CoV-2 S IgG in dependence of CD4+ T-cell levels (<310/µL versus >310/µL). (D) Anti-SARS-CoV-2 S IgG in dependence of treatment and compared to the control group. p-values are specified as follows: <0.05, *; <0.01, **; <0.001, ***.

