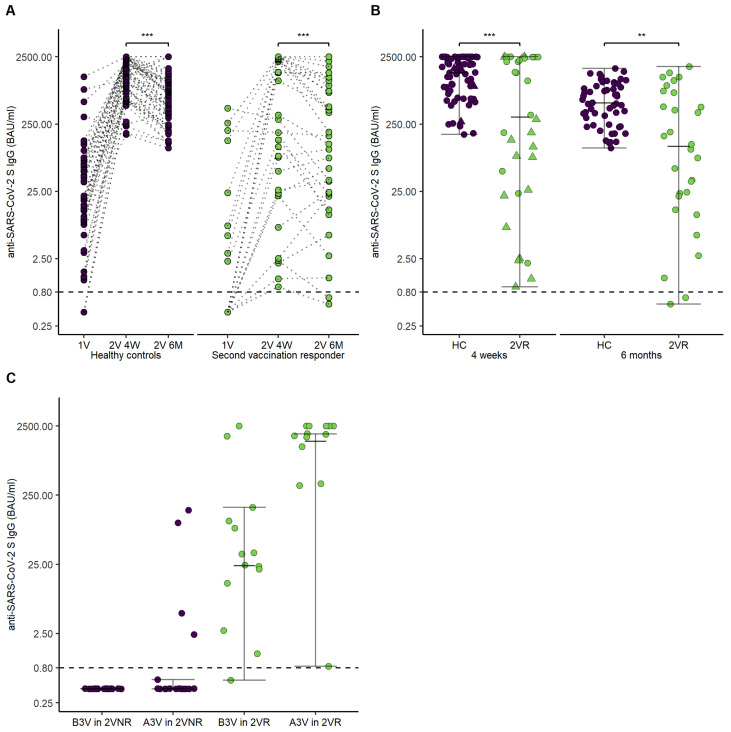
Figure 4.
Time course of anti-SARS-CoV-2 S IgG antibodies in healthy controls, second vaccination responders, and second vaccination non-responders. (A) Points and lines demonstrate individual anti-SARS-CoV-2 S IgG antibodies’ course after the first vaccination, four weeks after the second vaccination, and six months after the second vaccination for healthy controls and second vaccination responder. (B) Error bars demonstrate anti-SARS-CoV-2 S IgG antibodies for healthy controls and second vaccination responder four weeks and six months after the second vaccination. Points demonstrate individual anti-SARS-CoV-2 S IgG antibodies. The triangles show the five patients who received a third vaccination. (C) Error bars demonstrate levels of anti-SARS-CoV-2 S IgG antibodies before and after third vaccination in dependence of seroconversion status after the second vaccination. Abbreviations: 1V, first vaccination visit; 2V 4W, second vaccination visit after four weeks; 2V 6M, second vaccination visit after six months; B3V, before third vaccination; A3V, after third vaccination. p-values are specified as follows: <0.01, **; <0.001, ***.

