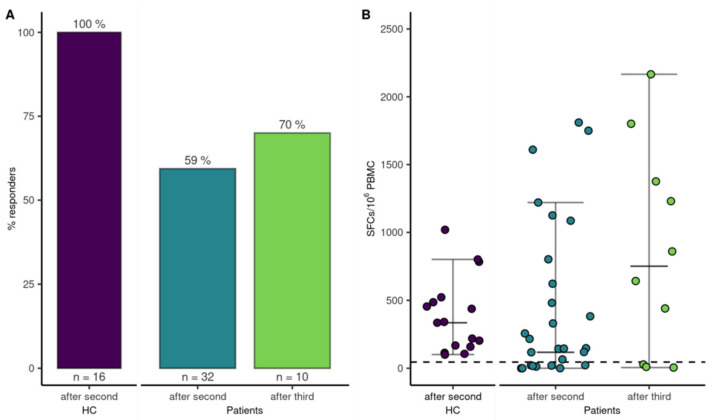
Figure 5.
T-cell response to mRNA SARS-CoV-2 vaccination. (A) Bars indicate proportion of patients with a T-cell response after the second and third vaccination and HCs after the second vaccination. (B) Dots represent quantitative T-cell responses in HCs and patients two-four weeks after the second vaccination and in a subgroup of patients four weeks after the third vaccination.

