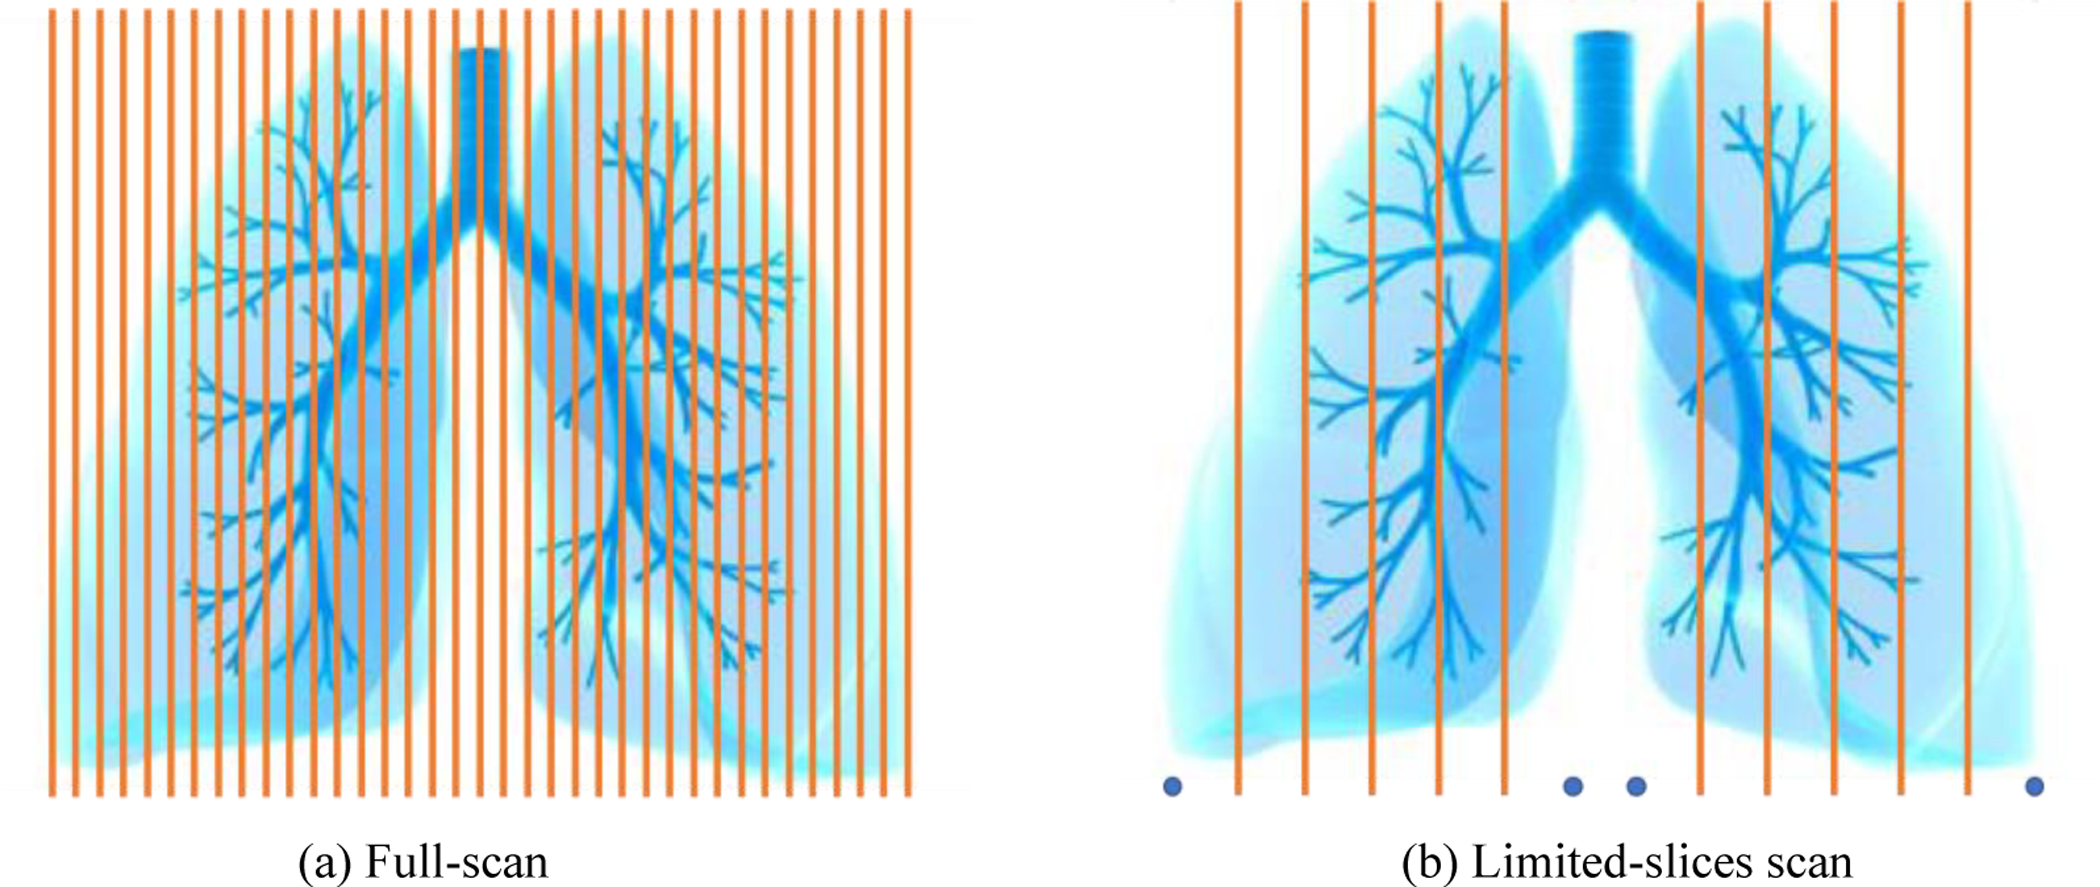
Figure 1.

A schematic diagram of full-scan and limited-slices dynamic thoracic MRI scan. Each line represents a sagittal slice location, and the blue points in (b) represent the left and right edges of each lung. Figure courtesy: http://raiganbabay.blogspot.com/
