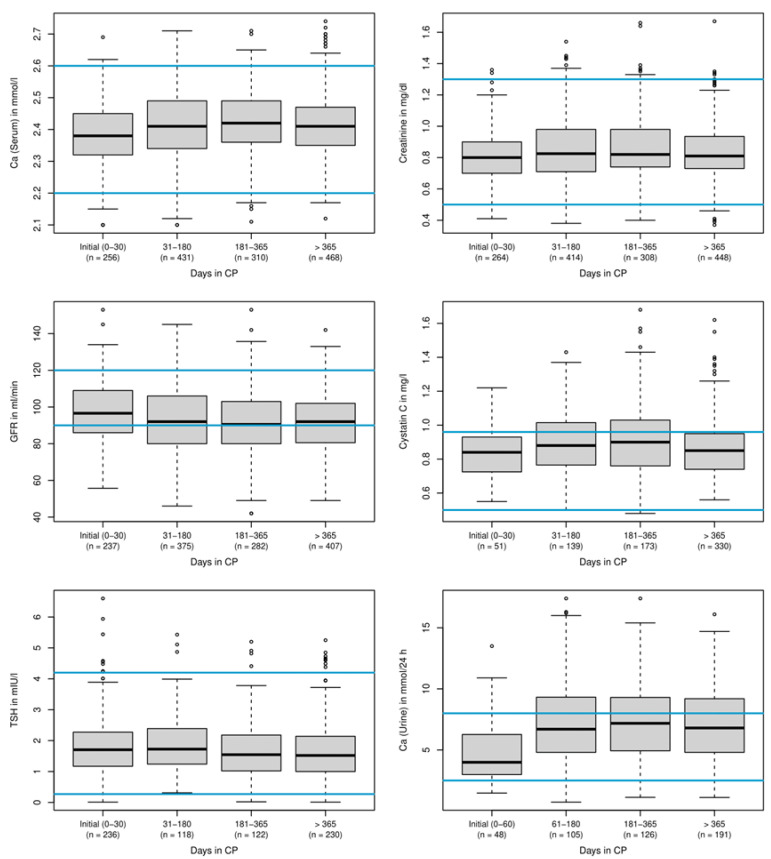
Figure 3.
Changes of laboratory parameters during treatment. Detailed median values: serum calcium levels (mmol/L) initial (0–30): 2.38/31–180: 2.41/181–365 2.42/>365: 2.41; serum creatinine levels (mg/dL) initial (0–30): 0.80/31–180: 0.83/181–365: 0.82/>365: 0.81; serum creatinine associated estimated GFR (ml/min) initial (0–30): 96.60/31–180: 92.00/181–365: 90.50/>365: 92.00; cystatin C levels (mg/L) initial (0–30): 0.84/31–180: 0.88/181–365: 0.90/>365: 0.85; TSH levels (mIU/L) initial (0–30) 1.71/31–180: 1.73/181–365: 1.55/>365: 1.52; renal calcium secretion within 24 h (mmol/24 h) initial (0–60): 3.99/31–180: 6.70/181–365: 7.18/>365: 6.80. Blue lines: upper and lower normal values. Individual points outside the whiskers indicate outliers more than 1.5 times the interquartile range away from the upper quartile. See also legend of Figure 2.

