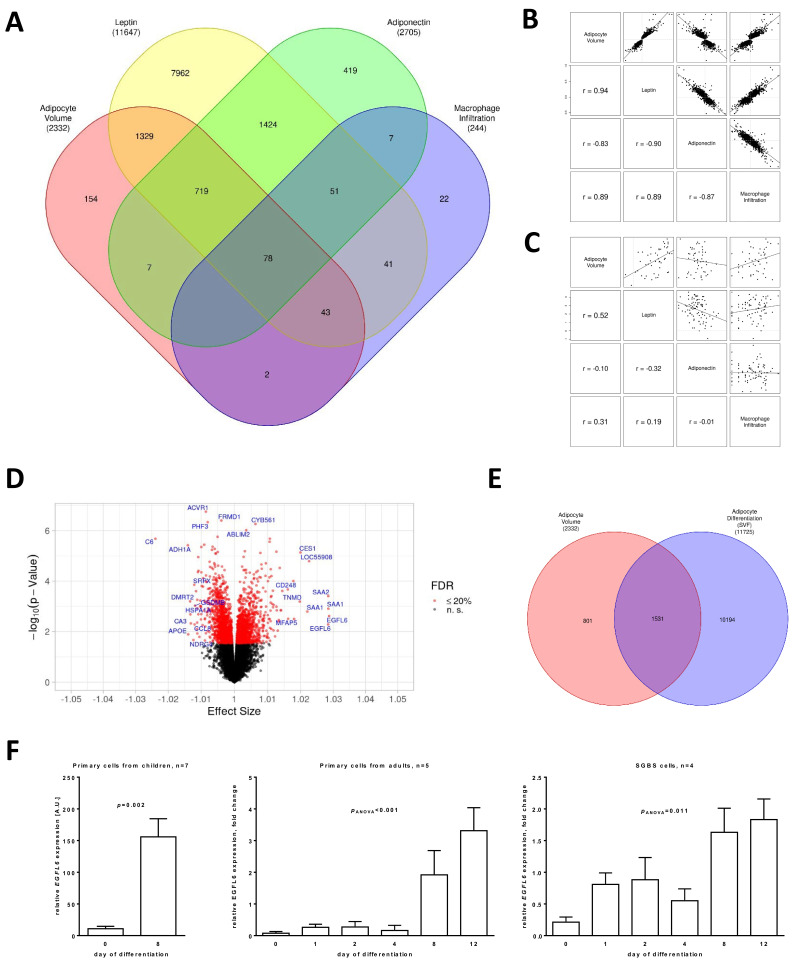
Figure 2.
Adipose tissue dysfunction was associated with alterations in gene expression in adipocytes of children. (A) Venn diagram displaying the number of significant (False discovery rate FDR ≤ 20%) transcripts for gene expression analyses of adipocyte size, leptin, adiponectin, and macrophage infiltration. The numbers in brackets provide the phenotype-wise total number of significant transcripts. (B) Scatter plots for comparison of effect sizes between adipocyte size, leptin, adiponectin, and macrophage infiltration. Significant (FDR ≤ 20%) transcripts from gene expression analysis of adipocyte size were used as the subset for plotting and correlation to provide equal number of transcripts for all pairings. (C) Scatter plots for comparison of measurements between adipocyte size, leptin, adiponectin, and macrophage infiltration. (D) Volcano plot of the results of gene expression analysis of adipocyte size. Annotation of genes with the lowest FDR (maximum 5 genes) and strongest positive/negative effect size (maximum 10 genes each) is provided. (E) Venn diagram displaying the number of significant (FDR ≤ 20%) transcripts for gene expression association analyses of adipocyte size and adipocyte differentiation. The numbers in brackets provide the total number of significant transcripts for each analysis. (F) Bar plots (with error bars) for gene expression of EGFL6 over time for primary cells from children (SVF) and adults as well as Simpson–Golabi–Behmel syndrome (SGBS) cells.

