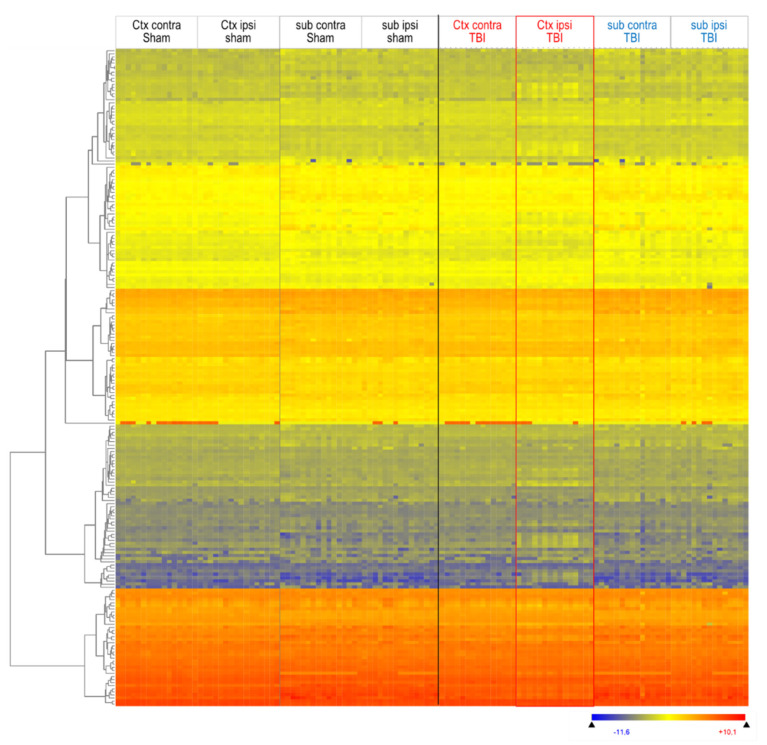
Figure 2.
Heatmap of lipid species in ipsilateral and contralateral cortical and subcortical brain tissue 5.6 months after TBI versus sham surgery. Lipids were submitted to hierarchical clustering using Euclidean squared distance metrics. Each horizontal line is a lipid species; each vertical line is a mouse at one site (n = 16 sham, n = 15 TBI mice). Mice are depicted in the sequence of their IDs. The left dendrogram shows the lipid clusters. The red rectangle highlights the deregulated group of TBI Ctx ipsilateral. The color scale ranges from −3 to +3 SD.

