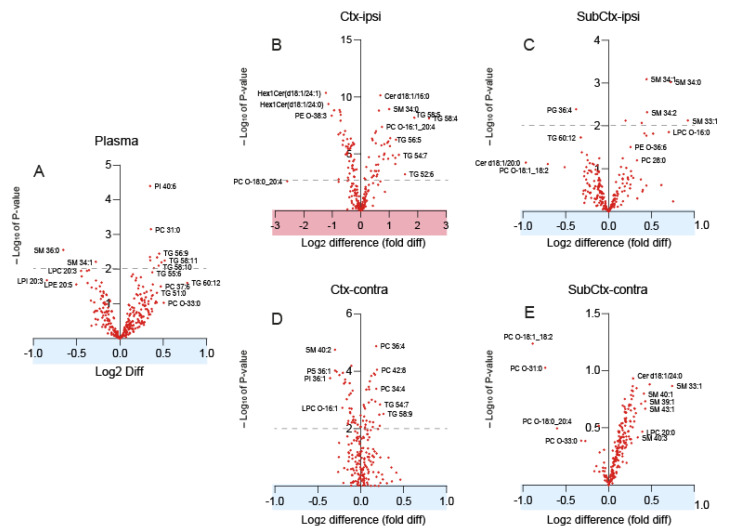
Figure 3.
Volcano plots of lipids in the plasma, ipsi-, and contralateral cortex and subcortex. The x-axes show the log2 difference between groups consisting in n = 16 sham and n = 15 TBI mice. Lipids that were increased in TBI are positive; those that were reduced are negative. The y-axis shows the negative logarithm of the t-test p-value. The dashed line indicates a p-value of 0.01. (A) Plasma. (B) Ctx-ipsi, ipsilateral perilesional cortex. (C) SubCtx-ipsi, ipsilateral subcortical brain. (D) Ctx-contra, contralateral cortex. (E) SubCtx-contra, contralateral subcortical brain. Abbreviations: TG, triacylglycerol; PC, phosphatidylcholine; SM, sphingomyelin; Cer, ceramide; LPC, lysophosphatidylcholine; PI, phosphatidylinositol; PS, phosphatidylserine.

