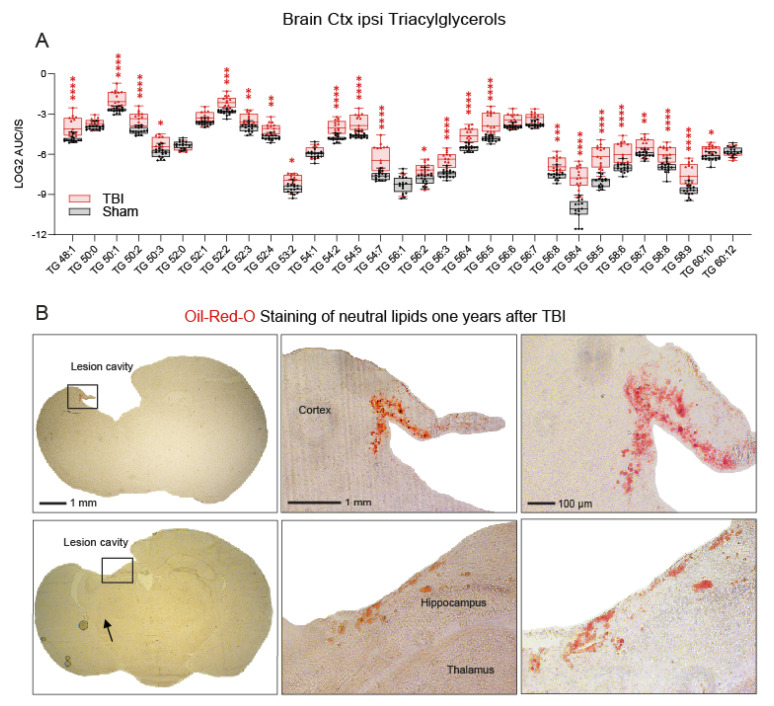
Figure 6.
Accumulation of triacylglycerols in the ipsilateral cortex after TBI. (A) Box/scatter plot of triacylglycerols of different chain lengths and saturation 5.6 months after the injury. The scatters represent individual mice, n = 16 sham and n = 15 TBI. The box shows the interquartile range; the whiskers range from minimum to maximum. The data were compared via two-way ANOVA for the TG X group (sham versus TBI) and subsequent post hoc analysis according to Šidák. * p < 0.05, ** p < 0.01, *** p < 0.001, **** p < 0.0001. The unit AUC/IS is the ratio of the area under the curve of the analyte of the mass spectrogram and the AUC of the internal standard (IS is listed in Supplementary Methods). (B) Oil Red O staining of neutral lipids in cryosections of TBI mice 12 months after the injury. The images show examples of brain sections at two different Bregma levels (−0.34 and −1.94 mm; according to the Paxinos and Franklin’s mouse brain atlas) from two different animals in order to illustrate that Oil Red O stains cells are consistently distributed at the border across the brain lesion irrespective of the Bregma position. The differences in lesion size are due to the different Bregma levels. The upper lesion cavity appears to be larger owing to a fusion with the lateral ventricle at Bregma −0.34. The left panel shows the overview; the right panels show high magnification views of the areas indicated by rectangles. Scale bars: 1 mm, 100 µm.

