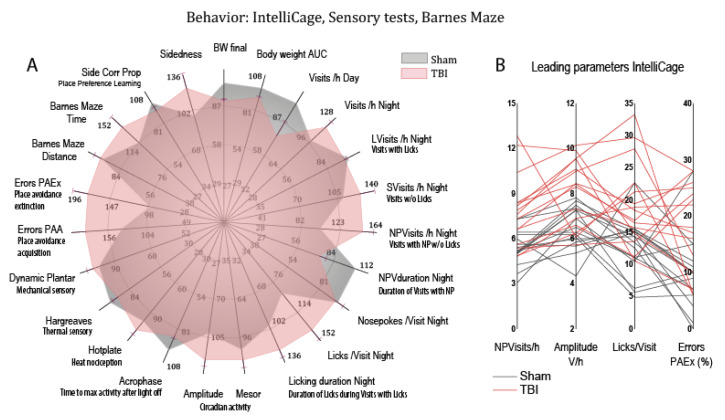
Figure 8.
Behavior of sham (n = 16, grey) versus TBI (n = 15, red) mice. Behavioral data were obtained in different tasks in IntelliCages (PAA (place avoidance acquisition), PAEx (place avoidance extinction), PPL (place preference learning), sidedness, circadian mesor, amplitude, acrophase), spatial learning on a Barnes maze, and sensory tests of thermal and mechanical perception and nociception (hotplate, Hargreaves, dynamic von Frey). (A) The polar plot shows multiple dimensions of behavior. To allow for a combined analysis of different readouts/units, raw data were transformed into percentages of the median of sham mice, and mean percentages were plotted on radial y-axes. Error bars are SEM of TBI mice. (B) Multiple line plots representing individual mice of four candidate behavioral parameters that contributed most to the discrimination between groups.

