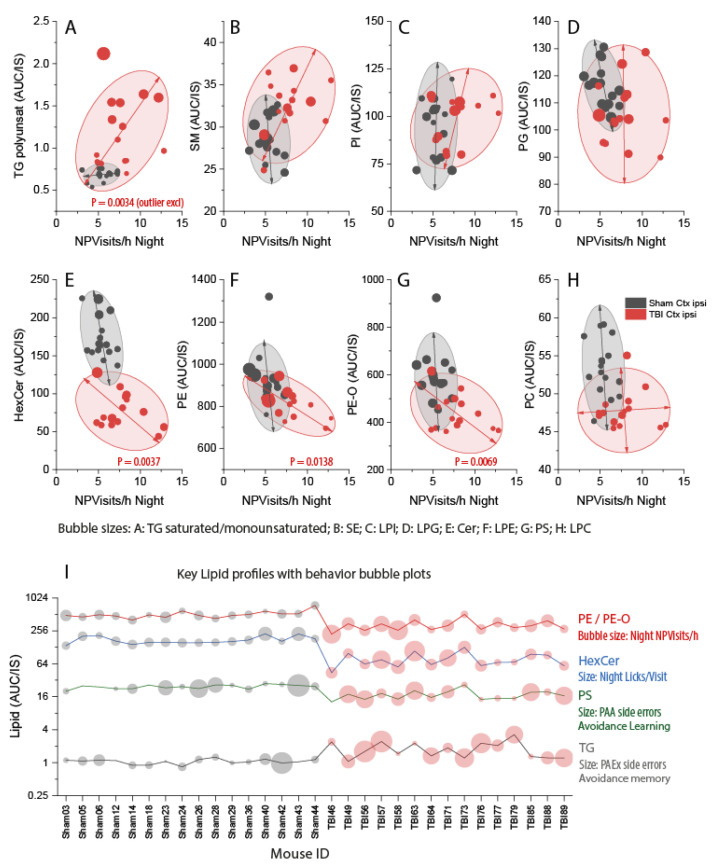
Figure 9.
Associations of non-goal-directed hyperactivity (x-axis) with lipid classes (y-axis) in the ipsilateral perilesional cortex of sham (n = 16, black) versus TBI (n = 15, red) mice. Non-goal-directed hyperactivity is represented by IntelliCage nighttime visits with nosepokes but without licks per hour (NPVisits/h) (X-axis). NPVisits/h were recorded daily, and the mouse’s nighttime average was used. NPVisits/h were associated with lipid classes on the y-axis. The bubble size is given by the respective lyso-form or by a related lipid. AUC/IS (unit) is the ratio of the area under the curve of the analyte and the AUC of the internal standard. Individual lipid species of different chain lengths and saturation were summed per lipid class. Scatters represent individual mice. The ellipses show the 85% CI of the prediction (outliers excluded). P-Values show statistically significant slopes of regression lines of TBI mice. (A–H) NPVisits/h versus lipids as indicated (y-axis). Bubble sizes as indicated. Abbreviations: TG, triacylglycerol; SM, sphingomyelin; SE, sterol ester; PI, phosphatidylinositol; LPI, lyso-PI; PG, phosphatidylglycerol; LPG, lyso-PG; HexCer, hexosylceramides; Cer, ceramides; PE, phosphatidylethanolamines; LPE, lyso-PE; PE-O, phosphatidylethanolamines with ether linkage; PS, phosphatidylserine; PC, phosphatidylcholine; LPC, lyso-PC. (I) Profile plot of key regulated PE, HexCer, PS, and TG per mouse. Bubble sizes show behavioral parameters as indicated. PAA, place avoidance acquisition; PAEx, place avoidance extinction.

