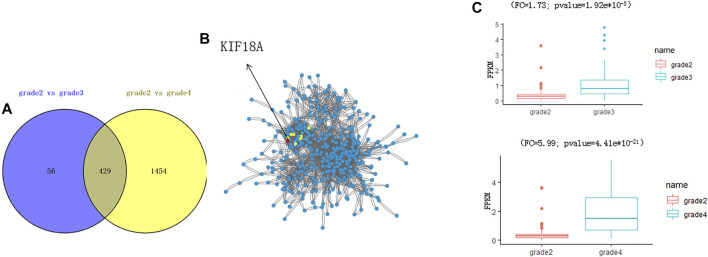
FIGURE 2.
Identification of KIF18A as a potential gene to affect the progression of glioma. (A) The plot shows the overlapping DEGs. (B) The network analysis shows the interaction of 429 DEGs. The red circle shows the top five hub genes in the network, including KIF18A. (C) The boxplot shows the expression level of KIF18A.

