. 2022 Apr 22;11:e73075. doi: 10.7554/eLife.73075

Figure 5. Expression of YAP target genes in WT and HD neuruloids.

(A) Violin plots show the expression of YAP and three representative target genes in the three clusters representing the main ectodermal lineages from scRNA-seq analysis of D4 neuruloids. Expression levels are normalized counts, calculated by Seurat for each gene and plotted on a logarithmic scale. (B) A volcano plot shows the greater expression of several YAP target genes in epidermis compared to the remainder of the neuruloid. (C) An analysis of differential gene expression from scRNA-seq data shows upregulation of YAP target genes (red) in HD with respect to WT neuruloids. (D) Violin plots show the expression of three representative YAP target genes in the three lineage clusters from D4 WT and HD neuruloids. The color code is: neural crest (NC), red; neural ectoderm (NE), blue; epidermis (E), yellow; and unidentified (NA), white. The augmented expression of YAP target genes is more pronounced in the nonepidermal lineages. (E) Gene-set enrichment analysis of YAP target genes confirms the effect. (F) Analysis by uniform manifold approximation and projection (UMAP) shows the ectopic enhancement of a representative YAP target, TUBB6, in D4 WT and HD neuruloids. Full statistics are provided in Figure 5—figure supplement 5. HD, Huntington’s Disease.

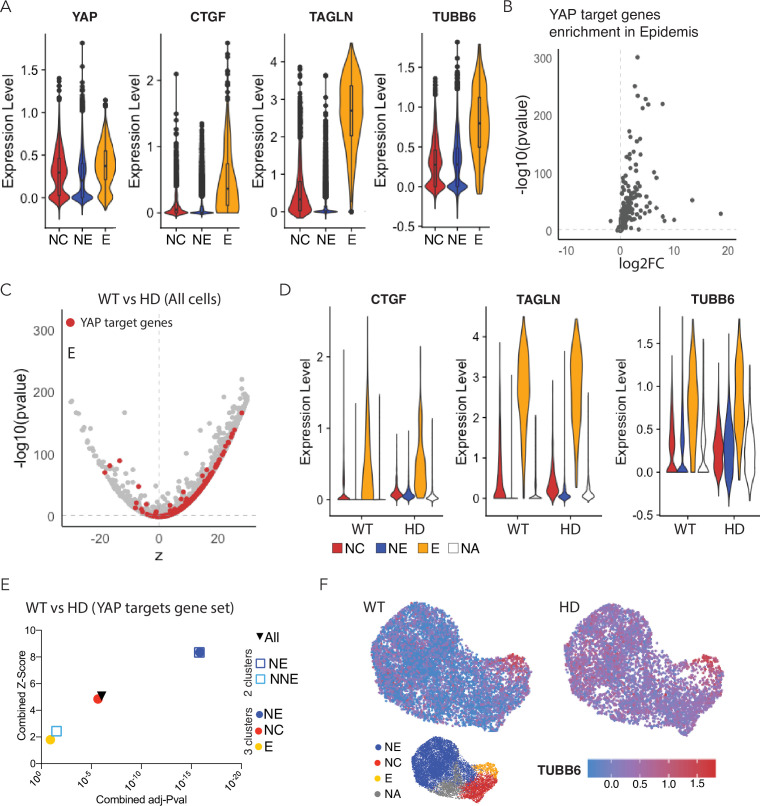
Figure 5.

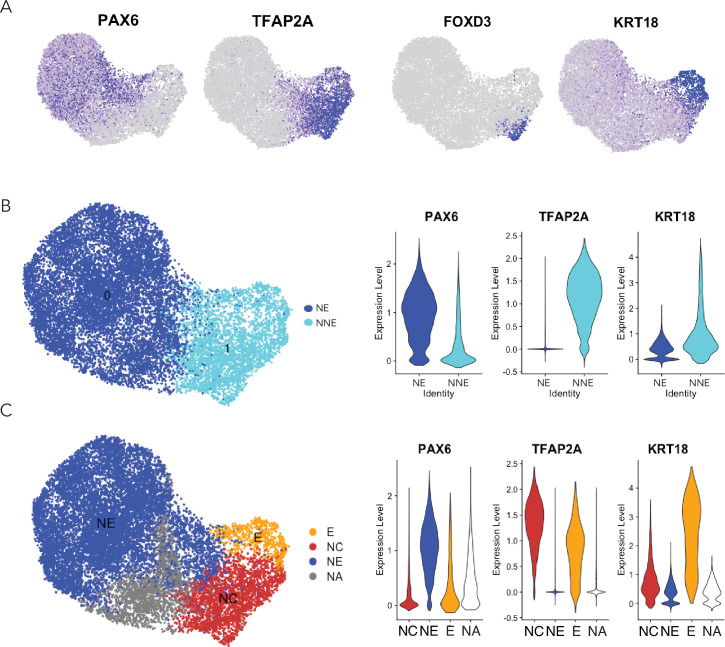
Figure 5—figure supplement 1. Ectodermal lineage annotation in scRNA-seq from D4 neuruloids.

Figure 5—figure supplement 1.

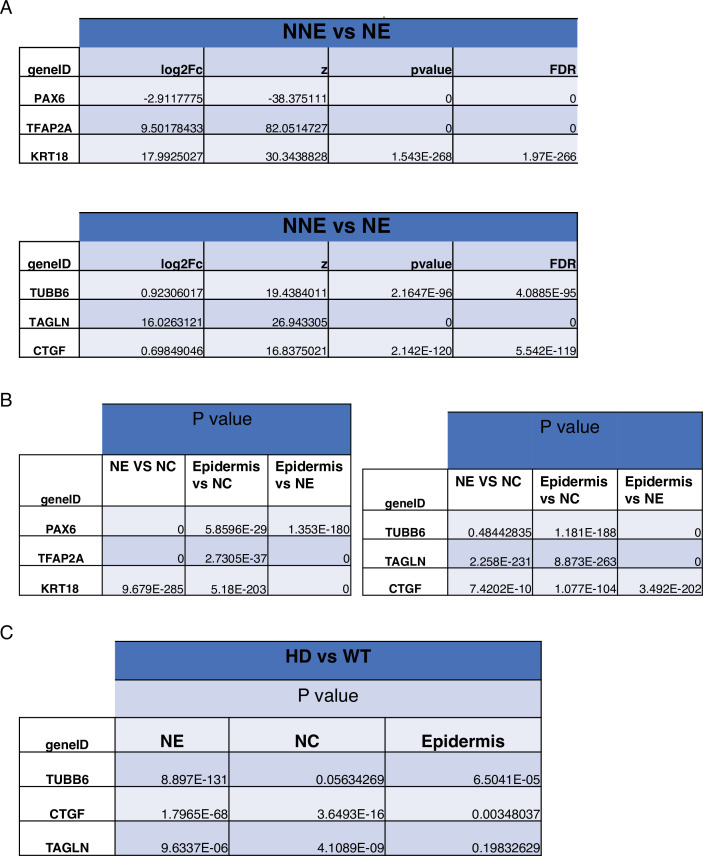
(A) Uniform manifold approximation and projection (UMAP) shows the expression of key ectodermal lineage makers: PAX6 identifies neural ectoderm (NE) and TFAP2A delineates nonneural ectoderm (NNE). Within the NNE, FOXD3 identifies progenitors of neural crest (NC) and KRT18 marks early epidermis (E).(B) On the left, a plot documents the separation of NE and NNE in UMAP. At the right, violin plots show the expression of lineage genes in the NE and NNE. (C) On the left, a plot demonstrates the separation of the three ectodermal lineages in UMAP. NA represents the population of unidentified cells. At the right, violin plots show the expression of lineage genes in the three populations.
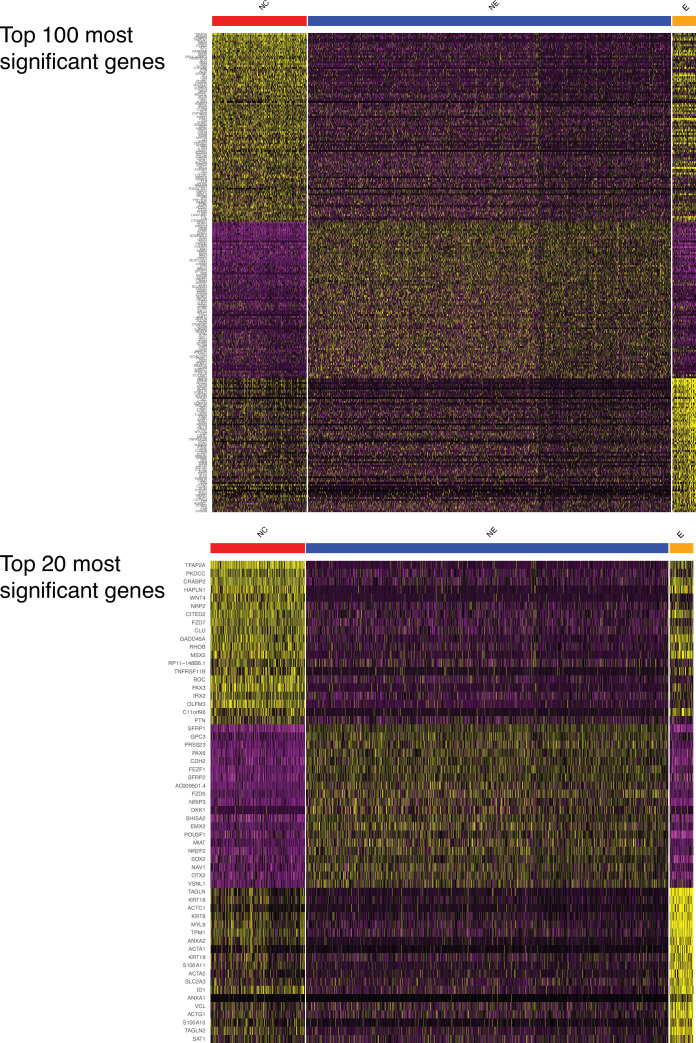
Figure 5—figure supplement 2. Marker genes for the three main human ectodermal lineages.

Figure 5—figure supplement 2.

(Top) A heatmap displays the 100 genes that are most significantly expressed differentially between the three lineages. (Bottom) An enlargement displays the 20 genes that are most significantly expressed differentially between the three lineages.
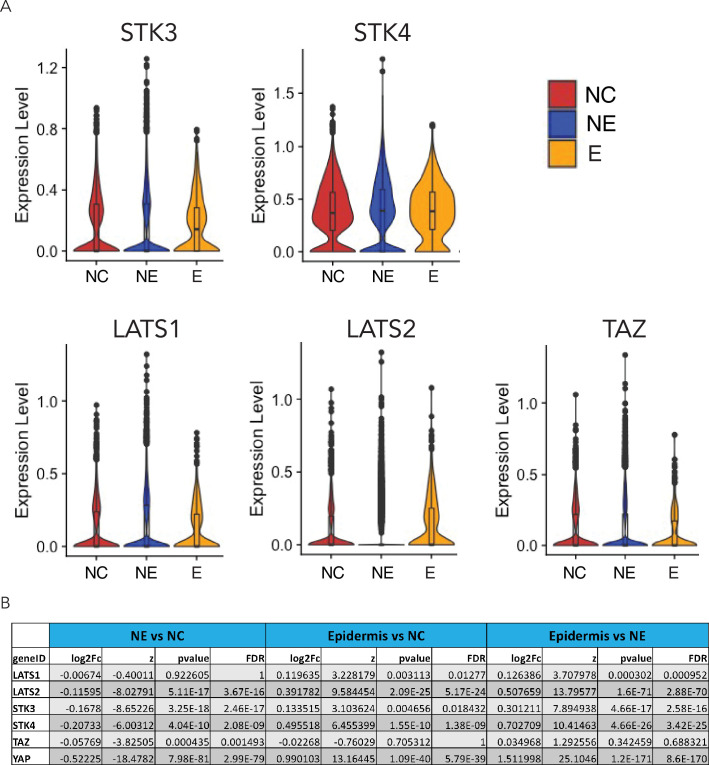
Figure 5—figure supplement 3. Expression of key components of the Hippo pathway in D4 neuruloids.

Figure 5—figure supplement 3.

(A) Violin plots document the expression of components of the Hippo pathway in the three ectodermal lineages. (B) A table summarizes the statistics for the pairwise differential-expression analysis of components of the Hippo pathway. YAP and key Hippo-pathway components can be found in all three lineages, but are more strongly expressed in NC and epidermis. NC, neural crest.
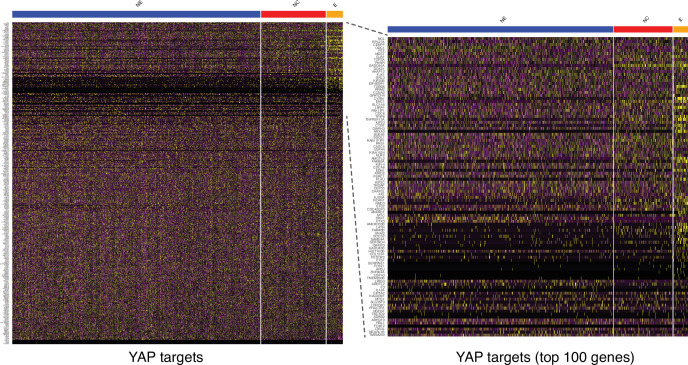
Figure 5—figure supplement 4. Expression of YAP targets in the three human ectodermal lineages at D4.

Figure 5—figure supplement 4.

(Left) A heatmap displays the expression of a large set of genes that are direct targets of YAP (Zanconato et al., 2015). (Right) The 100 genes most differentially expressed in epidermis show that YAP is active predominantly within precursors of the epidermal lineage, followed by neural crest (NC) and finally neural ectoderm (NE).
Figure 5—figure supplement 5. Statistical analysis of D4 neuruloids.

Figure 5—figure supplement 5.

These statistics pertain to the violin plots of Figure 4 and Figure 6.
Figure 5—figure supplement 6. Expression of YAP target genes in D7 WT and HD neuruloids.

Figure 5—figure supplement 6.

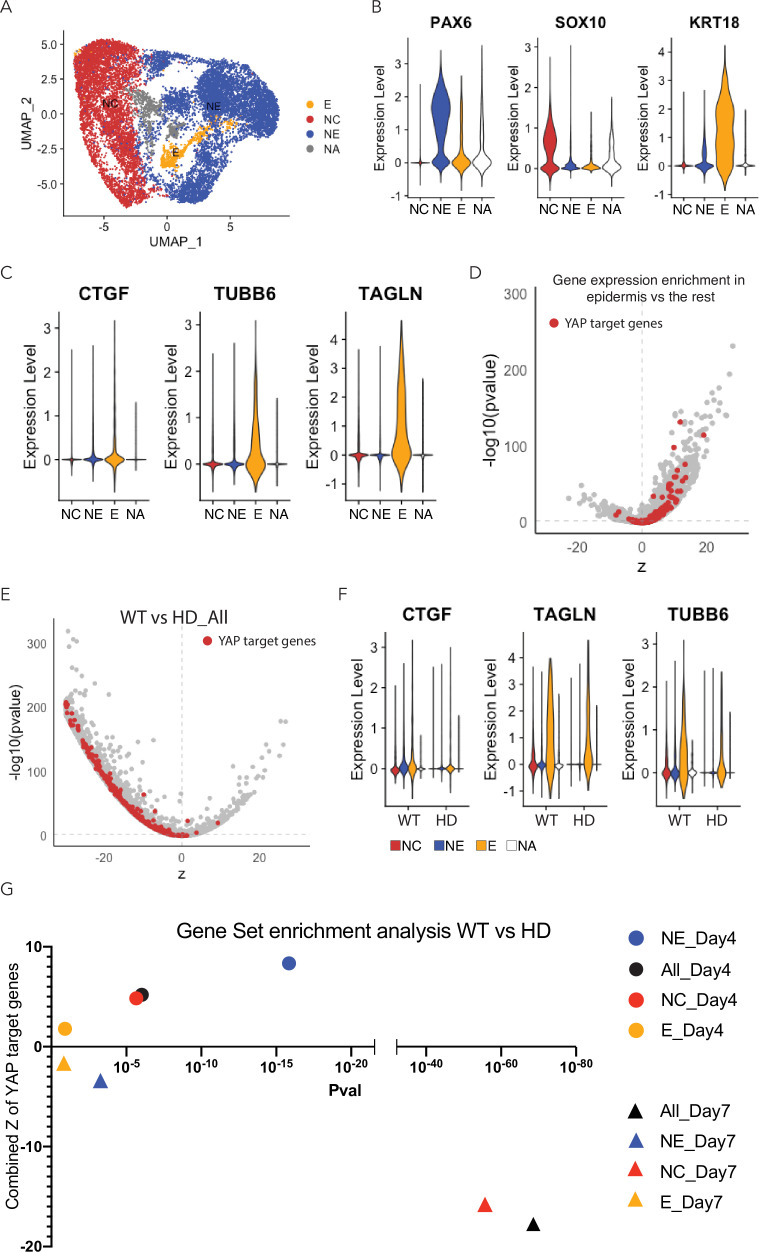
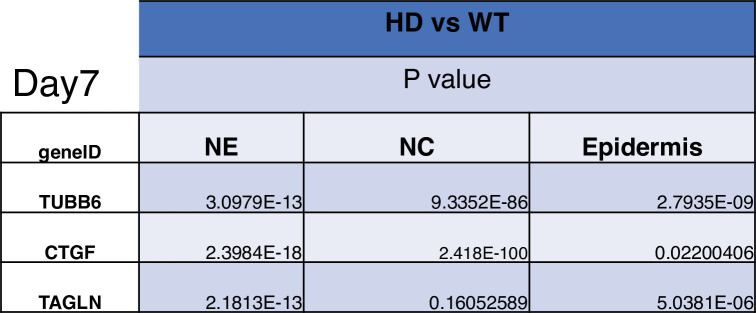
(A) Uniform manifold approximation and projection (UMAP) shows the distribution of the three major ectodermal lineages in D7 neuruloid: neural ectoderm (NE, blue), neural crest (NC, red), and epidermis (E, yellow). NA (gray) labels a cell population that was not identified. (B) Violin plots quantify the expression of key ectodermal lineage makers: PAX6 identifies neural ectoderm (NE), SOX10 identifies NC, and KRT18 identifies epidermis (E).(C) Violin plots quantify the expression of three representative YAP target genes in the three main ectodermal lineages from scRNA-seq analysis of D7 neuruloids. (D) An analysis of differential gene expression from scRNA-seq data confirms the greater expression of several YAP target genes (red) in epidermis compared to the remainder of the D7 neuruloid. (E) An analysis of differential gene expression from scRNA-seq data for whole D7 neuruloids shows downregulation of YAP target genes (red) in HD neuruloids with respect to that in WT neuruloids. (F) Violin plots show the expression of three representative YAP target genes in the three lineage clusters from D7 WT and HD neuruloids: NC (red), NE (blue), epidermis (E, yellow), and unidentified (NA, white). (G) Gene-set enrichment analysis of YAP target genes reveals reduced YAP activity in D7 HD neuruloids in NE and NC, but not in epidermis. An opposite pattern pertains in less mature D4 neuruloids. The relevant statistics appear in Figure 5—figure supplement 7. HD, Huntington’s Disease.
Figure 5—figure supplement 7. Statistical analysis of D7 neuruloids.

Figure 5—figure supplement 7.

The statistics refer to the violin plots of Figure 5—figure supplement 6.