. 2022 Apr 22;11:e73075. doi: 10.7554/eLife.73075

Figure 6. Perturbation of YAP activity in WT and HD neuruloids.

(A) Immunofluorescence images of D7 neuruloids show that the expansion of NE (PAX6, blue) at the expense of NC (SOX10, red) after exposure to 10 µM TRULI or in HD cells. Treatment with 0.3 µM verteporfin has no effect on WT colonies but partially rescues the effect of HD. (B) Side views portray neuruloids under the conditions used in (A). (C) The ratios of PAX6+ areas to control values under various conditions confirm the similarity of TRULI-treated WT neuruloids to HD neuruloids and the suppressive effect of verteporfin (WT colonies, n=36; WT+TRULI, n=36; HD, n=35). Rescue of this HD phenotype is stronger for early than for late exposure to verteporfin (HD, n=60, HD+VP D3–D7, n=35; HD+VP D5–D7, n=36; HD+VP D3–D5, n=25). ****, p<0.0001; ns, p>0.05 in unpaired t-tests comparing the different experimental conditions. (D) In a model of neurulation, YAP activity (green) is posited to favor nonneuronal fates, and hyperactivity (red)—either from TRULI treatment or HD—yields characteristic abnormalities. (E) A diagram illustrates the structure of a mature neuruloid and the effects on its architecture of YAP activation or HD mutation. HD, Huntington’s Disease; NE, neuronal ectoderm; NNE, nonneuronal ectoderm.

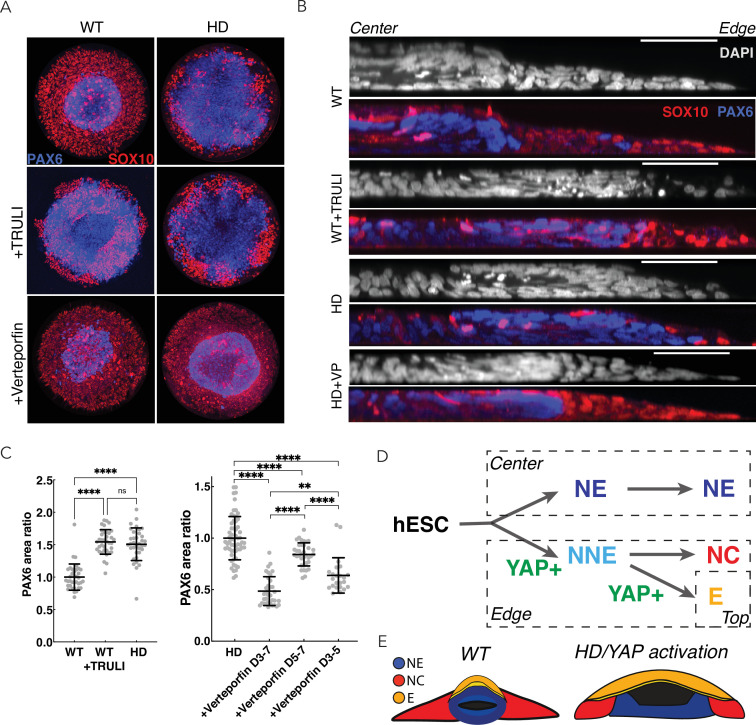
Figure 6.

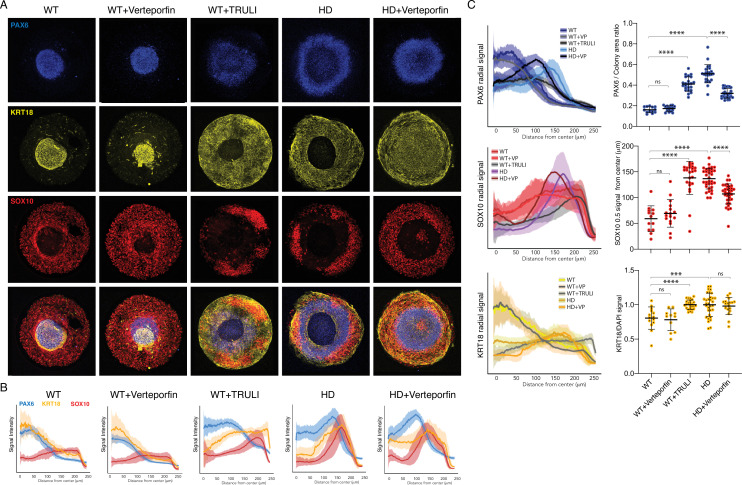
Figure 6—figure supplement 1. Perturbation of YAP activity in WT and HD neuruloids.

Figure 6—figure supplement 1.

(A) Immunofluorescence images of D7 neuruloids show that treatment with 0.3 µM verteporfin has no effect on WT colonies, whereas treatment with 10 µM TRULI results in the expansion of the central area of NE (PAX6, blue) and enhancement of the epidermal population (KRT18, yellow) at the expense of NC (SOX10, red). This phenotype resembles that of HD colonies. The NE and NC phenotypes of HD colonies are partially rescued by treatment with 0.3 µM verteporfin. (B) Quantitative analysis of the three experimental conditions shows radial distributions of the lineage markers PAX6, SOX10, and KRT18 in several colonies. (C) On the left, radial distributions quantify the lineage markers PAX6, SOX10, and KRT18 in the five experimental conditions. At the right, plots show the area of the PAX6+ central region as a fraction of each entire colony, the radial distance from the colony’s center to the half-maximal intensity of the SOX10 domain, and the KRT18 signal normalized by DAPI labeling. ***, p<0.001; ****, p<0.0001; ns, p>0.05 in unpaired t-tests comparing the different experimental conditions (WT, n = 13; WT +VP, n=17; WT +TRULI, n=23; HD, n=24; HD+VP, n=28). Legends for Videos. HD, Huntington’s Disease; NC, neural crest; NE, neuronal ectoderm; NNE, nonneuronal ectoderm.