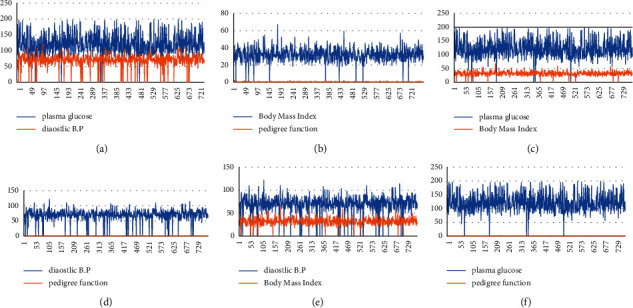
Figure 3.

((a)–(f)) Two-dimensional distribution of PIMA Indians diabetes dataset. (a) Line plot between glucose and blood pressure. (b) Line plot between mass and pedigree function. (c) Line plot between glucose and mass. (d) Line plot between pressure and pedigree. (e) Line plot between pressure and mass. (f) Line plot between glucose and pedigree.
