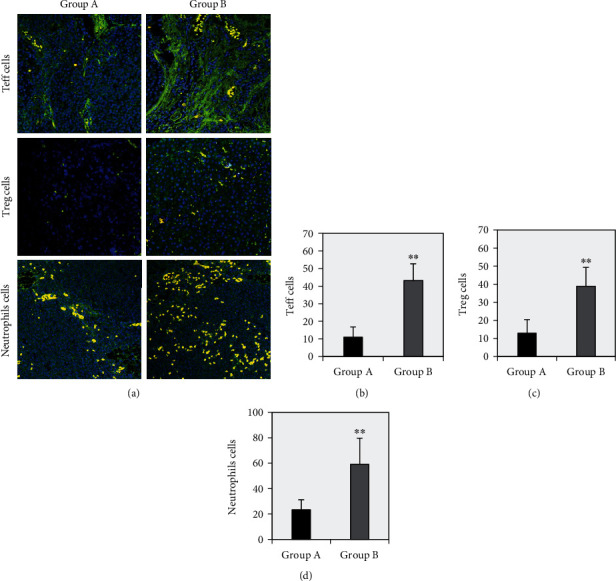
Figure 4.

The immunofluorescence staining results of Teff cells, Treg cells, and neutrophils in ESCC tissues of two groups of patients. Note: Panel (a) showed the fluorescence microscopic observation of Teff cells, Treg cells, and neutrophil immunofluorescence staining (magnification 400x); panels (b), (c), and (d) were the average number of positive staining cells of Teff cells, Treg cells, and neutrophils, respectively (different immune cells in the figure were coexpressed as yellow fluorescence). ∗∗ suggested that compared with group A, there was a very significant difference (P < 0.01).
