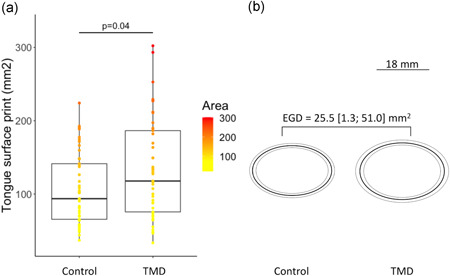
Figure 3.

Significantly larger tongue print area for the temporomandibular disorder (TMD) group compared with the control group. (a) Boxplot representing the area of the tongue print where bottom, top, and middle lines in the box represent 1st, 3rd quartiles, and median, respectively, and the two vertical bars extend to the minimum to maximum values (b); ellipses representing the median (dark line) and the lower and upper limit of the 95% confidence interval of the median (light lines and gray area) of participants of the control group (left panel) and TMD group (right panel). The estimated median group difference (EGD) and its 95% confidence interval was a tongue print area larger by 25.5 [1.3; 51.0] mm2 for patients with TMD as compared with control participants
