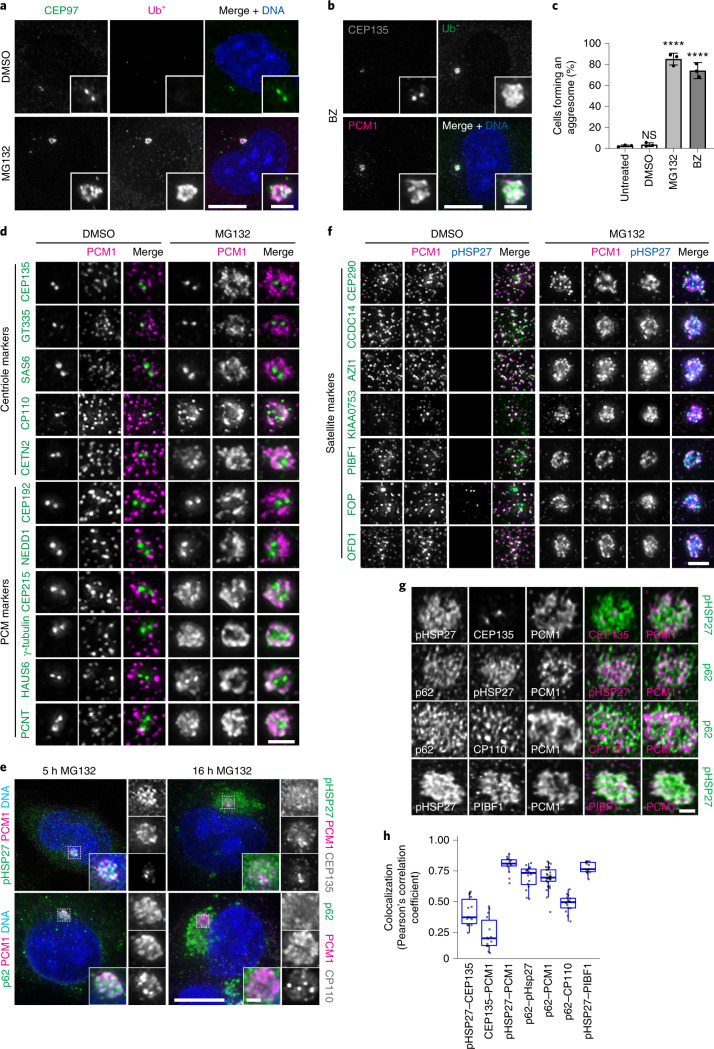
Fig. 1. Centrosome and centriolar satellite proteins localize to the aggresome after proteasome inhibition.
a, RPE-1 cells treated with DMSO or MG132 were stained for CEP97, ubiquitinated proteins (Ub+) and DNA (4,6-diamidino-2-phenylindole (DAPI)). b, RPE-1 cells treated with bortezomib (BZ) were stained for CEP135, Ub+, PCM1 and DNA (DAPI). c, The percentage of cells that formed an aggresome in untreated cells and in cells treated with DMSO, MG132 or BZ as revealed by Ub+ staining. Data displayed as the mean ± s.d., n = 3 independent experiments. ****P < 0.0001 or not significant (NS) by two-tailed unpaired Student’s t-test. d, RPE-1 cells treated with DMSO or MG132 were stained for PCM1 and the indicated protein. e, A-375 cells treated with MG132 for 5 or 16 h were stained as indicated. f, RPE-1 cells treated with DMSO or MG132 were stained for PCM1, pHSP27 and the indicated protein. g, Super-resolution images of aggresomes in MG132-treated RPE-1 cells stained as indicated. h, Colocalization between the indicated protein pairs from individual z-planes of super-resolution images of RPE-1 cells treated with MG132 displayed using Pearson’s correlation co-efficient. Boxes represent the median, upper and lower quartiles, whiskers represent 1.5× the interquartile range, with individual values from two independent experiments superimposed. Scale bars, 1 μm (g), 2 μm (d,f; insets of a,b,e) or 10 μm (a,b,e). Numerical data and P values are provided as source data.

