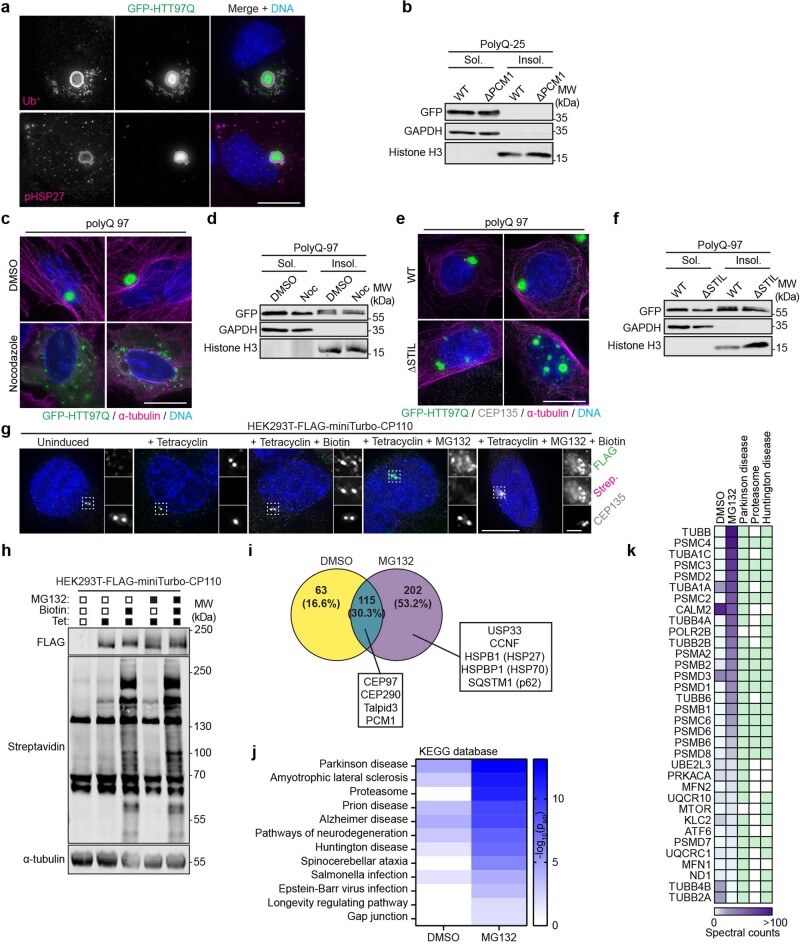
Extended Data Fig. 7. HTT-polyQ inclusion formation requires microtubules and a functional centrosome.
(a) RPE-1 cells were transiently transfected with GFP-HTT97Q and stained for pHSP27 or Ub+. DNA was stained with DAPI. Scale bar 10 μm. (b) Immunoblot of soluble and insoluble fractions from WT and PCM1 KO cells transfected with GFP-HTT25Q. GAPDH and Histone H3 were used controls for the soluble and insoluble fractions, respectively. (c) Cells were transfected with GFP-HTT97Q for 5 hours, then treated with DMSO or nocodazole for 5 hours before being fixed and stained for GFP and α-tubulin. Scale bar 10 μm. (d) Immunoblot of soluble and insoluble fractions from cells prepared as in c. GAPDH and Histone H3 were used controls for the soluble and insoluble fractions, respectively. (e) WT and STIL KO U-2 OS cells were transiently transfected with GFP-HTT97Q then stained for GFP, CEP135 and α-tubulin. Scale bar 10 μm. (f) Immunoblot of soluble and insoluble fractions from cells prepared as in e. GAPDH and Histone H3 were used controls for the soluble and insoluble fractions, respectively. (g) HEK293T-FLAG-miniTurbo-CP110 cells were treated and stained as indicated. Scale bar 10 μm, 2 μm. (h) Immunoblot of HEK293T-FLAG-miniTurbo-CP110 cells treated and probed as indicated. α-tubulin was used as a loading control. (i) The number of preys from DMSO- or MG132-treated groups. Preys were defined as detailed in the Methods. (j) Functional enrichment analysis was performed with the preys from i. using g:Profiler and the KEGG database. (k) Spectral counts from the genes which are implicated in Parkinson’s disease, proteasome function or Huntington’s disease are shown. Genes which are related to the respective pathways are marked in green. Unprocessed immunoblots are provided as source data. For i,j,k: the raw mass spectrometry data and analysis giving rise to these panels is available in Supplementary Table 2.

