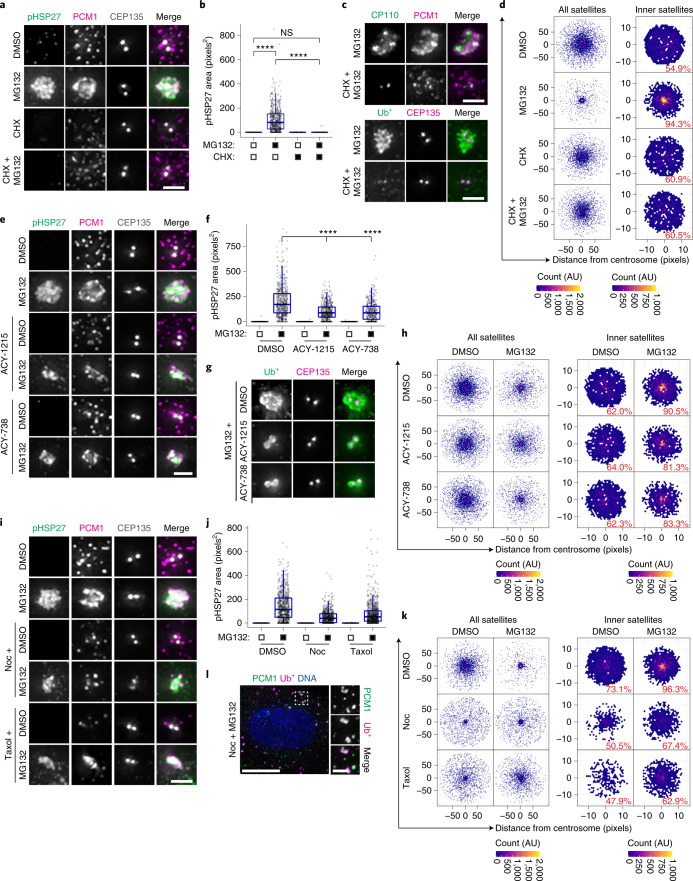
Fig. 2. High-resolution quantitative analysis confirms the requirement for protein translation, HDAC6 and microtubules in aggresome formation.
a, RPE-1 cells treated with DMSO, MG132, cycloheximide (CHX), or CHX plus MG132 were stained as indicated. b, The area occupied by pHSP27 in cells treated as in a. n = 493 (DMSO), 630 (MG132), 459 (CHX) and 437 (CHX + MG132) aggresomes examined over 2 independent experiments. ****P < 0.0001. c, Cells treated with MG132 with or without pretreatment with CHX were stained as indicated. d, Intensity maps of PCM1 distribution relative to the centrosome in cells treated as in a. The percentage of PCM1 signal residing in the defined inner region is indicated. AU, arbitrary units. e, RPE-1 cells treated with DMSO or MG132 were treated concurrently with ACY-1215 or ACY-738 and stained as indicated. f, The area occupied by pHSP27 in cells treated as in e. n = 586 (DMSO), 566 (MG132), 470 (ACY-1215), 504 (ACY-1215 + MG132), 470 (ACY-738) and 395 (ACY-738 + MG132) aggresomes examined over 2 independent experiments. ****P < 0.0001. g, RPE-1 cells treated with MG132 with or without ACY-1215 or ACY-738 were stained as indicated. h, PCM1 distribution relative to the centrosome in cells treated as in e. i, RPE-1 cells were pretreated with nocodazole (Noc) or taxol followed by DMSO or MG132 and stained as indicated. j, The area occupied by pHSP27 in cells treated as in i. n = 554 (DMSO), 499 (MG132), 413 (Noc), 422 (Noc + MG132), 510 (taxol) and 485 (taxol + MG132) aggresomes examined over 2 independent experiments. ****P < 0.0001. k, PCM1 distribution relative to the centrosome in cells treated as in i. l, RPE-1 cells treated with MG132 and nocodazole were stained as indicated. For b, f and j, boxes represent the median, upper and lower quartiles, whiskers represent 1.5× the interquartile range, with individual values superimposed. Data were compared using Kruskal–Wallis analysis of variance (ANOVA) test, and post-hoc Dunn multiple comparison test was performed to calculate P values. Scale bars, 2 μm (a,c,e,g,i; inset of l) or 10 μm (l). Numerical data and P values are provided as source data. AU, arbitrary units.

